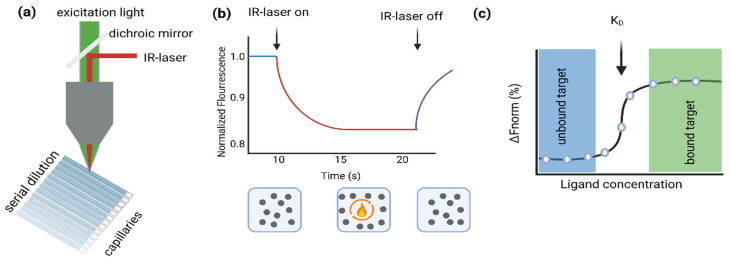
Figure 1.
(a) Schematic representation of the MST assay. (b) (Upper panel.) Representative MST trace showing fluorescence measurement upon IR stimulation (On/Off) over the indicated time period. (Lower panel.) Schematic representation of the response of the proteins in solution upon IR stimulation. (c) Representative fitting of the fluorescent values obtained for the different ligand concentrations at a given time point of the MST traces. The figure was created using the BioRender software (https://www.biorender.com).

