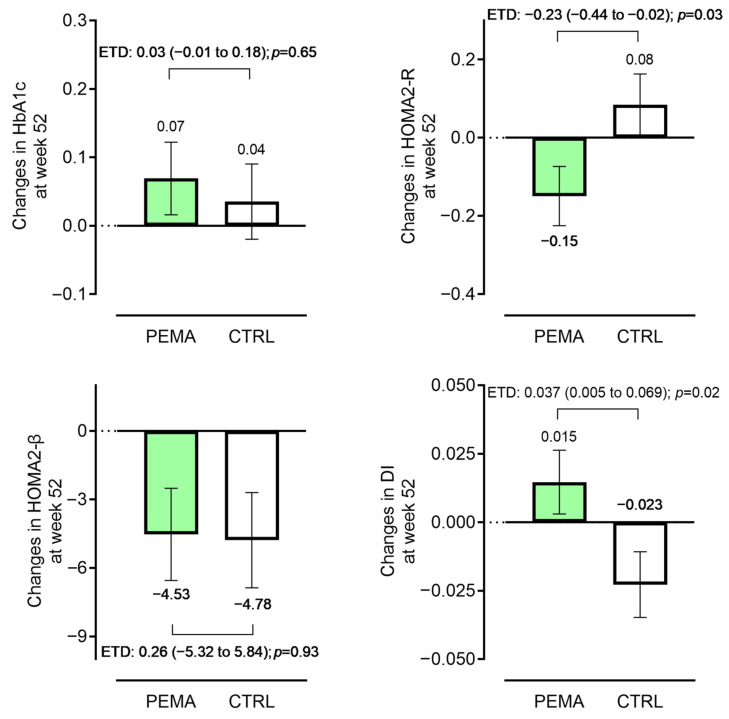
Figure 2.
Changes in key endpoints from baseline. Changes in glycated hemoglobin (HbA1c), homeostatic model assessment (HOMA) 2-R, HOMA2-β, and disposition index (DI) during the 52-week study period (pemafibrate group versus control group). Data were adjusted for ANCOVA (covariates: baseline HbA1c and fibrate use for HbA1c; each baseline value, HbA1c, and fibrate use for HOMA2-R, HOMA2-β, and DI, respectively). Bars represent adjusted mean ± standard error. Differences between the two groups are shown as the estimated treatment difference (ETD) (95% confidence interval). CTRL, control; PEMA, pemafibrate.

