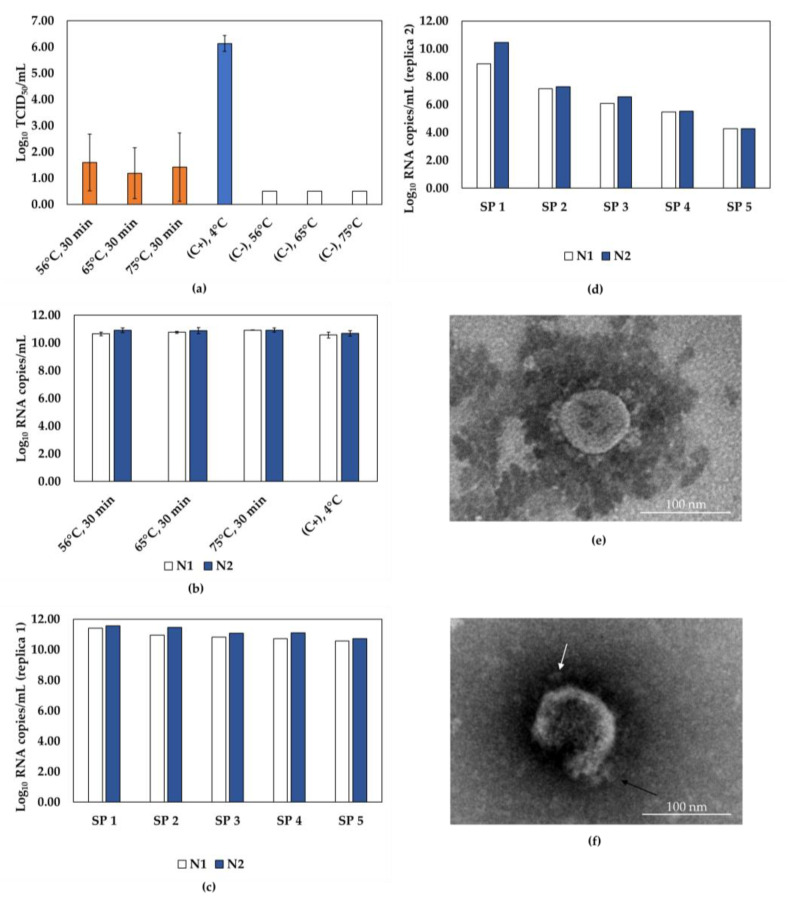
Figure 2.
Efficiency of SARS-CoV-2 inactivation by heat. (a) SARS-CoV-2 infectivity incubated at different temperatures (56 °C, 65 °C, and 75 °C) for 30 min, as assessed by TCID50 assays. Inactivated samples represented by orange bars, non-inactivated virus control (C+) represented by the blue bar, and negative control (C-, inactivating agent) represented by white bars. (b) RT-qPCR quantification of molecular targets N1 (white bars) and N2 (blue bars) in heat-inactivated samples, and (c,d) samples from 5 serial passages of SARS-CoV-2 incubated at 65 °C, 30 min (independent replicas 1 and 2). (e) Representative transmission electron microscopy (TEM) image of SARS-CoV-2 untreated, and (f) SARS-CoV-2 subjected to 65 °C, 30 min. Spikes of the viral particle are indicated by arrows. Scale bar, 100 nm; SP, serial passage; C+, positive control; C-, negative control.

