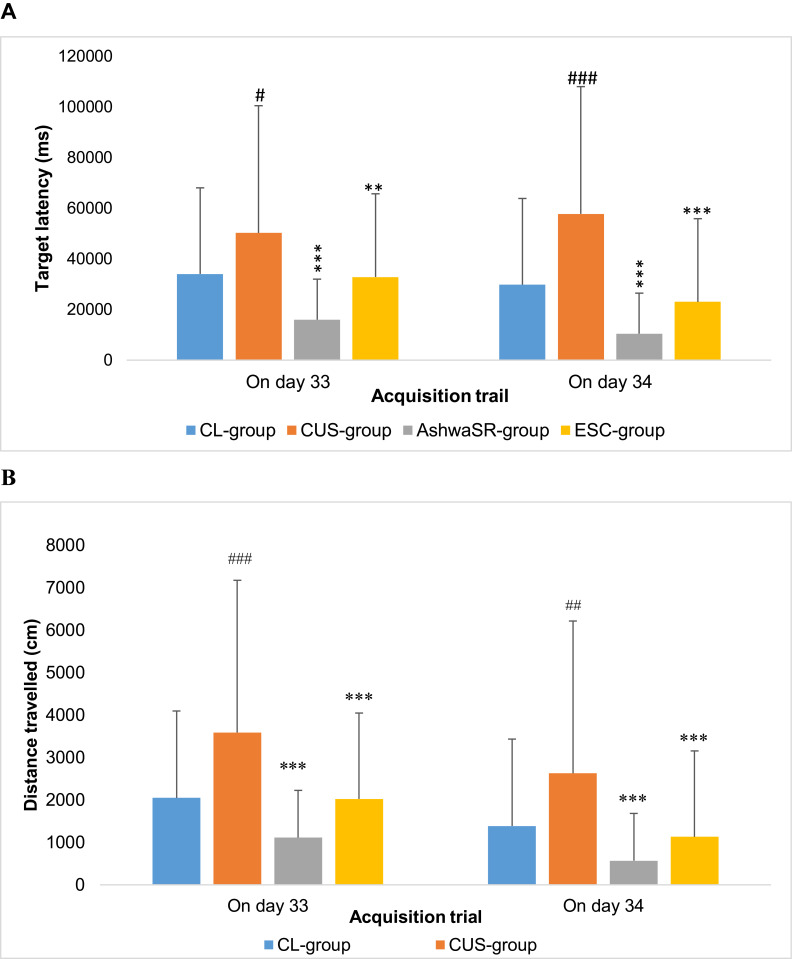
Figure 5.
(A) Results of target latency from acquisition trail on days 33 and 34 by Morris water maze (MWM) test. **p < 0.01; ***p < 0.001 vs CUS control; #p < 0.05; ###p < 0.001 vs normal control; one-way ANOVA followed by Dunnett’s test. (B) Results of distance travelled from acquisition trail on days 33 and 34 using the MWM test. ***p < 0.001 vs CUS control; ##p < 0.01; ###p < 0.001 vs normal control; one-way ANOVA followed by Dunnett’s test.

