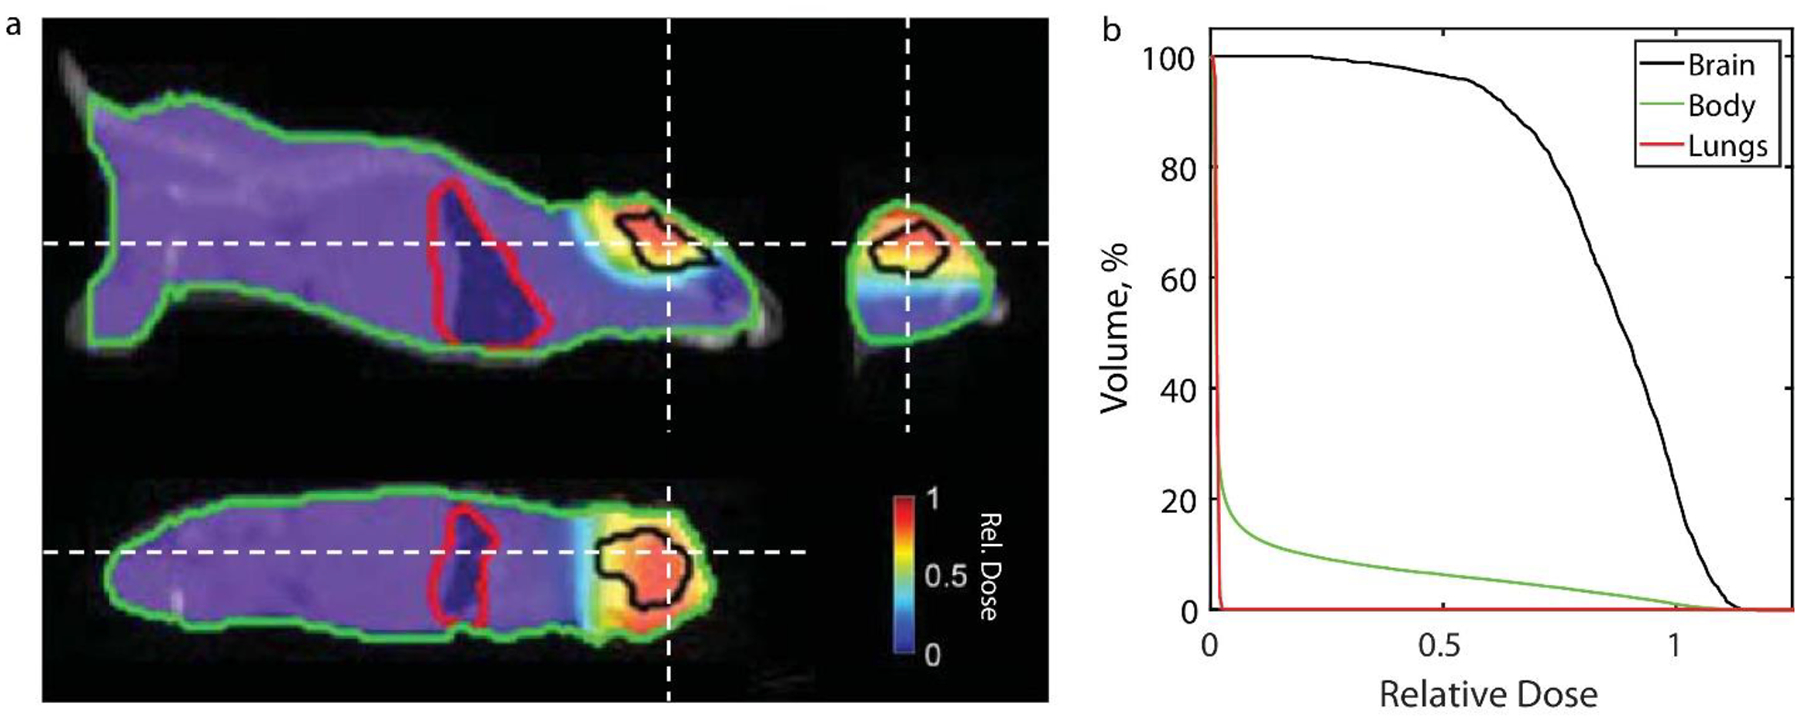
Figure 5.

a. Dose distribution at orthogonal views and b. cumulative dose volume histogram for an irradiated brain of a mice with a 1.5 cm circular Cerrobend cutout from GAMOS simulation (dose distribution in water phantom is included in supplementary figure 2A). Dashed white lines in the orthogonal views indicate the slice location for the other two perspectives.
