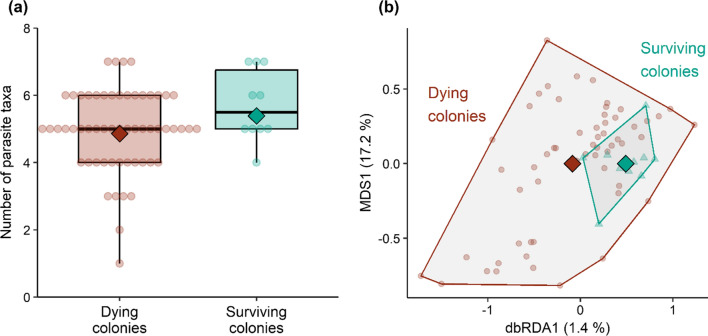
Fig. 3.
Comparison of parasite burden in dying (N = 57) and surviving (N = 10) feral honeybee colonies in the preceding summer. a Number of parasite taxa detected per colony among the 18 microparasites assayed. Diamonds on top of boxplots give model-estimated means, and dots are raw data. b Graphical representation of relative differences in parasite community composition as created by a distance-based redundancy analyses with “winter survival” as the constraining factor (effect of region partialled out). Percentages for the constrained axis (dbRDA1) and the first unconstrained axis (MDS1) give the share of explained community variation. Diamonds are means and dots (dying colonies) and triangles (surviving colonies) represent parasite communities of individual colonies

