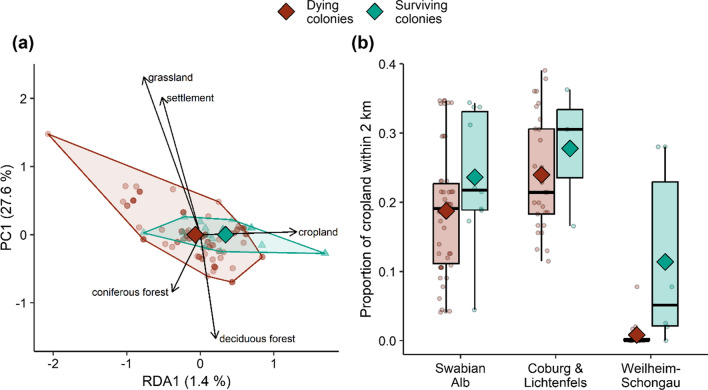
Fig. 8.
Comparison of circular landscapes (radius: 2 km) surrounding dying (N = 94) and surviving (N = 19) feral honeybee colonies. a Differences in the composition of landscapes as revealed by a redundancy analysis with winter survival as the constraining factor (regional differences partialled out). Percentages give the share of landscape variation explained by the constrained axis (RDA1) and the first unconstrained axis (PC1). Diamonds are means, and dots (dying colonies) and triangles (surviving colonies) represent the landscapes surrounding individual colonies. The five arrows represent the correlations of the five land cover types with the ordination axes (RDA1 is correlated with the proportion of cropland). b Comparison of the proportion of cropland in landscapes surrounding dying and surviving colonies for each of the three study regions. Dots are raw data and diamonds are means

