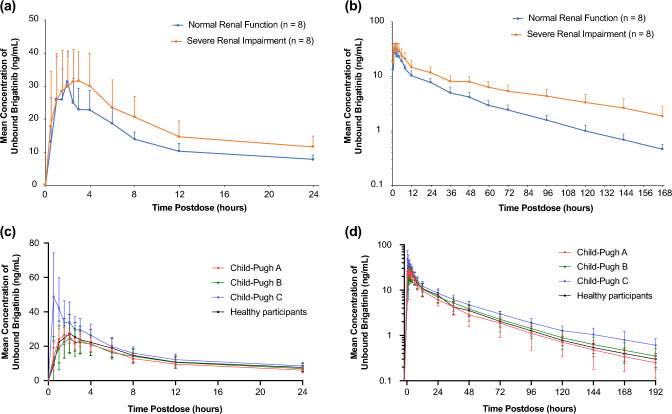
Fig. 6.
Mean (± standard deviation) unbound brigatinib plasma concentration–time profiles from a 0 to 24 h postdose, linear scale and b from 0 to 168 h post-dose, log-linear scale in patients with normal renal function versus severe renal impairment, and c from 0 to 24 h post-dose, linear scale, and d from 0 to 192 h postdose, log-linear scale in patients with normal hepatic function versus chronic hepatic impairment [34, 41, 48]. Figure 5a, b are reprinted from Gupta et al. [34]. Figure 5c, d are adapted from Hanley et al. [48]

