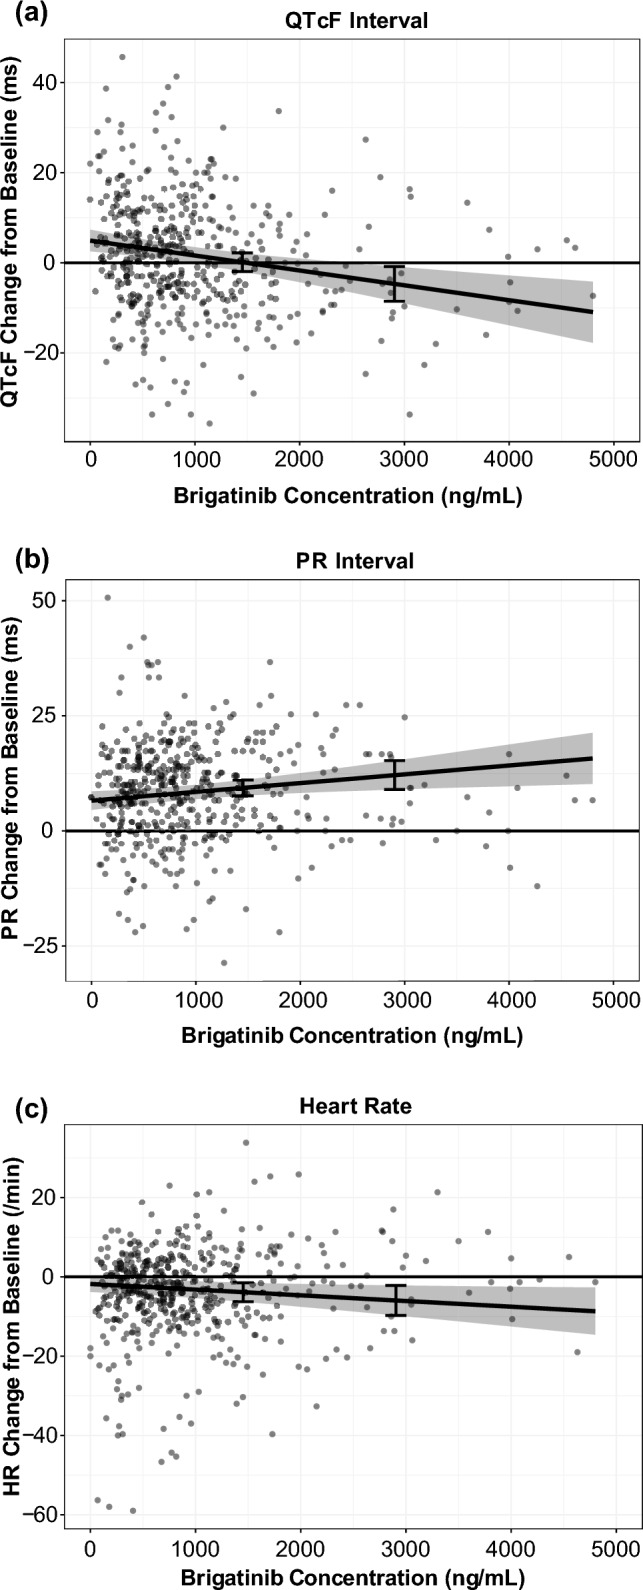
Fig. 8.

Scatterplots of a the QT interval corrected using Fridericia’s formula (QTcF) [23], b the PR interval, and c heart rate (HR) responses versus brigatinib concentrations with model-predicted typical responses and a 90% confidence interval. Dots represent brigatinib concentrations, and in each graph, the line and gray area represent the model-predicted typical responses and 90% confidence intervals. Error bars show the response at 1452 ng/mL (i.e., geometric mean steady-state maximum plasma concentration at 180 mg once daily) and 2904 ng/mL (i.e., maximum plasma concentration for patients with impaired elimination, corresponding to twice the geometric mean steady-state maximum plasma concentration). Adapted from Gupta et al. [23]
