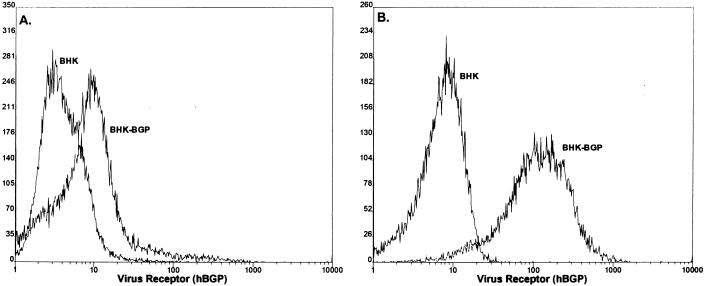
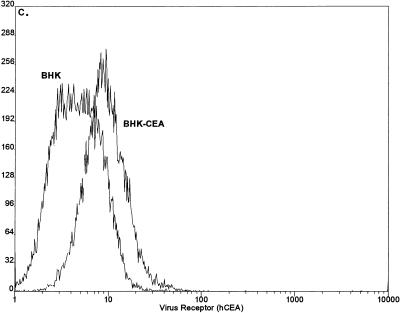
FIG. 6.
Expression of hCEA and hBgp in BHK cells. BHK cells were transfected with transcripts from the pSinRep19-hBgp and pSinRep19-hCEA replicons and selected with puromycin (5 μg/ml) for several days. By using monoclonal antibody Kat4c, the cultures were sorted into cell lines BHK-hBgp1 (A), BHK-hBgp1+ (B), and BHK-hCEA (C). These cell lines were grown into large stocks of cell lines expressing relatively uniform levels of hCEA or hBgp. FACS analysis was performed with monoclonal antibody Kat4c as previously described (12).


