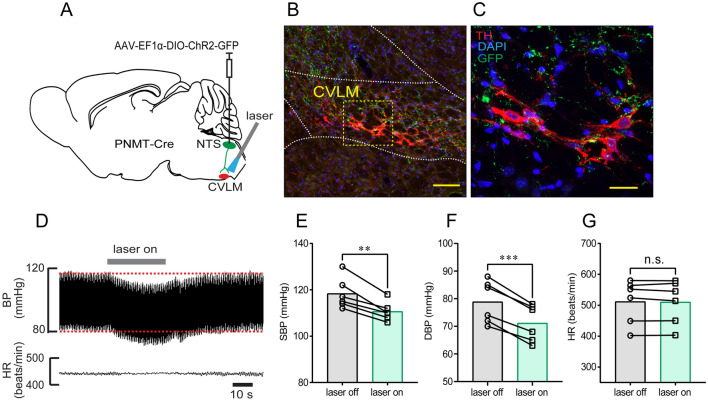
Fig. 5.
Optogenetic stimulation of NTSPNMT neurons projecting to the CVLM lowers BP. A Schematic of a strategy of optogenetic stimulation. B Confocal image showing the distribution of axons (green) of NTSPNMT neurons projecting to the CVLM. The hallmark of CVLM is indicated by staining with TH (red). Scale bar, 50 μm. C Confocal image enlarged from the region denoted by the square in B. Scale bar, 20 μm. D Typical traces showing a decrease in BP but not HR when illuminating the CVLM. E–G Statistical analyses of group data. n = 6, **P <0.01, ***P <0.001, paired t-test.

