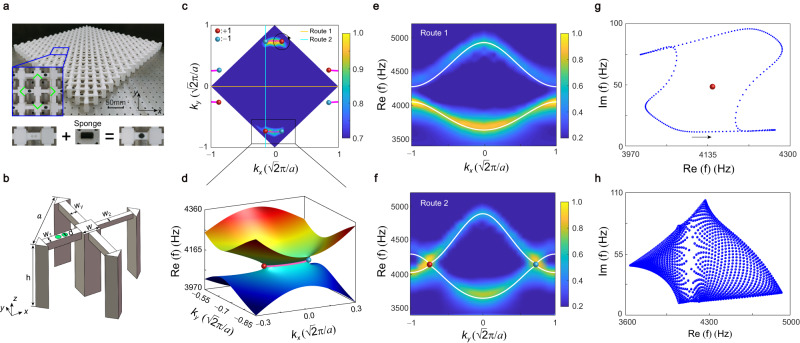
Fig. 2. EPs with bulk Fermi arcs and nonzero spectral area in the 2D non-Hermitian PC.
a Top panel: photograph of the sample with an enlarged part shown in the inset, where the green dashed lines enclose a unit cell. Bottom panel: Loss is induced by the holes on the waveguide sealed with the sound-absorbing sponges. b Schematic of the PC unit cell. c Simulated and measured bulk Fermi arcs at 4150 Hz. The magenta solid lines are the simulated result, which agrees well with measured one shown by color maps in the first BZ. Red (blue) spheres denote EPs with topological charge +1 (−1). d Calculated real part of bulk band dispersion for the range enclosed by the black framework in c, which exhibits a pair of EPs connected by a bulk Fermi arc. e, f Simulated (white lines) and measured (color map) dispersion curves for routes 1 and 2 depicted in c, respectively. g Spectral loop on the complex plane plotted along the anticlockwise direction of the black circle route around the EP in c. The red sphere denotes the energy projection point of the enclosed EP. h Complex spectra of the PC under periodic boundaries showing nonzero spectral area, giving rise to the GDSE.

