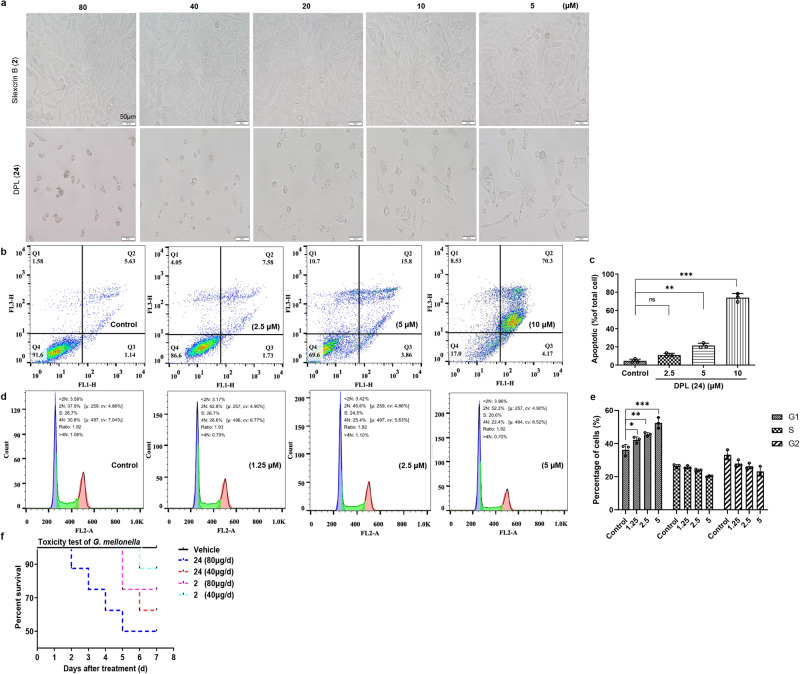
Fig. 5. DPL (24)- or silexcrin B (2)-induced cytotoxicity in HUVECs in vitro and G. mellonella in vivo.
a Growth state of HUVECs induced by different concentrations of silexcrin B (2) or DPL (24) in vitro. b The HUVEC line was treated with 0, 2.5, 5, or 10 μM DPL (24), and cell apoptosis was detected by flow cytometry analysis coupled with Annexin V-FITC/PI staining. c Quantification panel shows the statistical analysis of cell apoptosis in a dose-dependent manner. (one-way ANOVA, n = 3, P = 0.0687 > 0.05, **P = 0.003 < 0.01, ***P < 0.001 vs. the control group. The error bars are reported as mean ± SD.) d Cells were treated with 0, 1.25, 2.5, or 5 μM DPL (24), and cell cycle arrest was also detected by flow cytometry analysis coupled with PI staining. e Quantification panel shows the statistical analysis of cell cycle arrest. (one-way ANOVA, n = 3, *P = 0.0496 < 0.05, **P = 0.0053 < 0.01, ***P < 0.001 vs. the control group. The error bars are reported as mean ± SD). f Toxicity test of silexcrin (2) and DPL (24) on G. mellonella in the survivorship curve.

