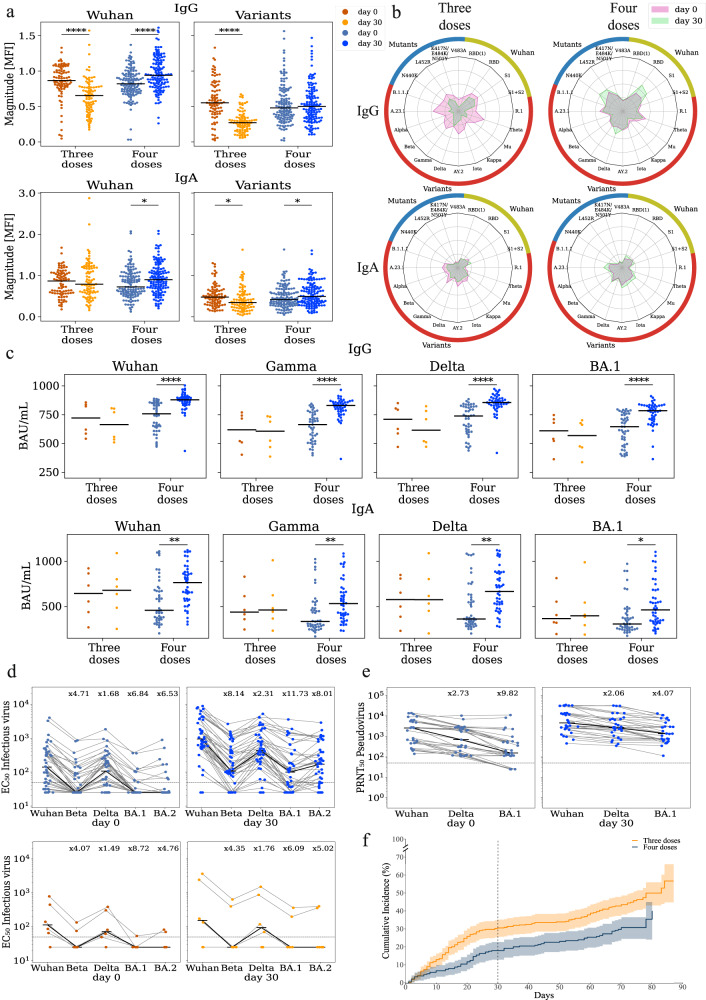
Fig. 1. Vaccination with the 4th dose elicited binding and neutralizing antibodies against SARS-CoV-2.
Responses of uninfected participants were analyzed at enrollment (day 0) and at day 30 using multiple serological assays. a IgG and IgA magnitude to antigens from the Wuhan strain and SARS-COV-2 variants of concern including Alpha, Beta, Gamma, Delta, Iota, Kappa, Mu, Theta, and several sub-variants (see Supplementary Data 5). Antigen microarrays spotted with receptor binding domain (RBD), S1 and spike proteins of the Wuhan vaccine strain and multiple other variants of concern were used to measure the magnitude of responses at day 0 (enrollment) and day 30 post enrollment n = 212 biologically independent samples. Black lines denote the median. b Spider plots depicting the enrollment (pink) and day 30 (green) antibody levels to Wuhan antigens (gold), variants of concern (red) and RBD mutants (blue). The average normalized magnitude to each antigen is plotted in individuals that received 3 or 4 doses. c IgG and IgA anti RBD ELISA binding titers for a subset of 51 uninfected participants. Black lines denote the median. d Infectious virus neutralization half maximal effective concentration (EC50) titers of the same individuals in c. top - uninfected individuals that received 4 doses n = 44 (blue). bottom - uninfected individuals that received 3 doses n = 6 (orange). Black lines denote the median. e Pseudovirus neutralization titers of uninfected individuals that received 4 doses n = 30 biologically independent samples (blue). Black lines denote the median. f Cumulative incidence of SARS-CoV-2 infections in participants receiving three doses n = 365 vs. four doses n = 243 biologically independent samples of the Pfizer vaccine. Four doses of the vaccine significantly reduced infection rates at day +30 (HR = 0.55, p = 0.002) and across all interim followup time (HR = 0.63, p = 0.003) as compared to three doses. The line represents cumulative incidence, and shaded bands denotes the 95% confidence intervals. P-values were computed using the two-sided wilcoxon ranksum test. *p < 0.05; **p < 0.001; ****p < 0.00001.

