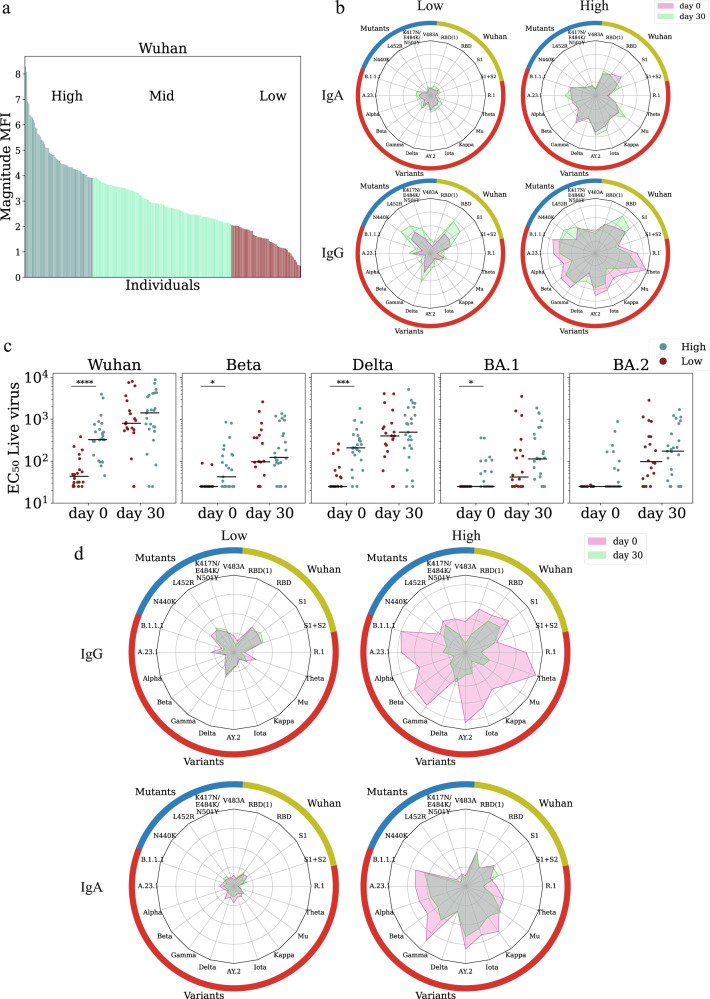
Fig. 2. Ranking individuals using baseline binding antibody markers is associated with baseline neutralizing titers.
a Ranking of 242 vaccinated individuals by their magnitude to SARS-CoV-2 Wuhan at enrollment. Each bar represents the magnitude of a single participant defined as the average response to the set Wuhan antigens (see Supplementary Data 5). Participants were divided into low (lowest quartile); mid (quartiles 2 + 3); and high (highest quartile) based on magnitude of IgA responses to Wuhan. b Spider plots of the average normalized responses in the low-baseline immune history (BIH) and high-BIH groups to a set of spike and receptor binding domain (RBD) proteins including the Wuhan spike and RBD, RBD mutants, and multiple SARS-CoV-2 variants of concern (see Supplementary Data 5) spike proteins. Responses of the low and high response groups of 127 uninfected individuals that received a fourth boost are plotted separately for IgA (top) and IgG (bottom). c Infectious-virus neutralization titers of 45 vaccinated uninfected individuals at day 0 and day 30 from the low-baseline (red) and high-baseline (teal) groups. Black lines denote the median. P-values were computed using the two-sided wilcoxon ranksum test.*p < 0.05; ***p < 0.0001; ****p < 0.00001. d Average IgA and IgG spider plots of 85 individuals that received 3 doses of the vaccine at day 0 (pink) and day 30 (green). Individuals were sorted by baseline response to SARS-CoV-2 variants of concern (VOC).

