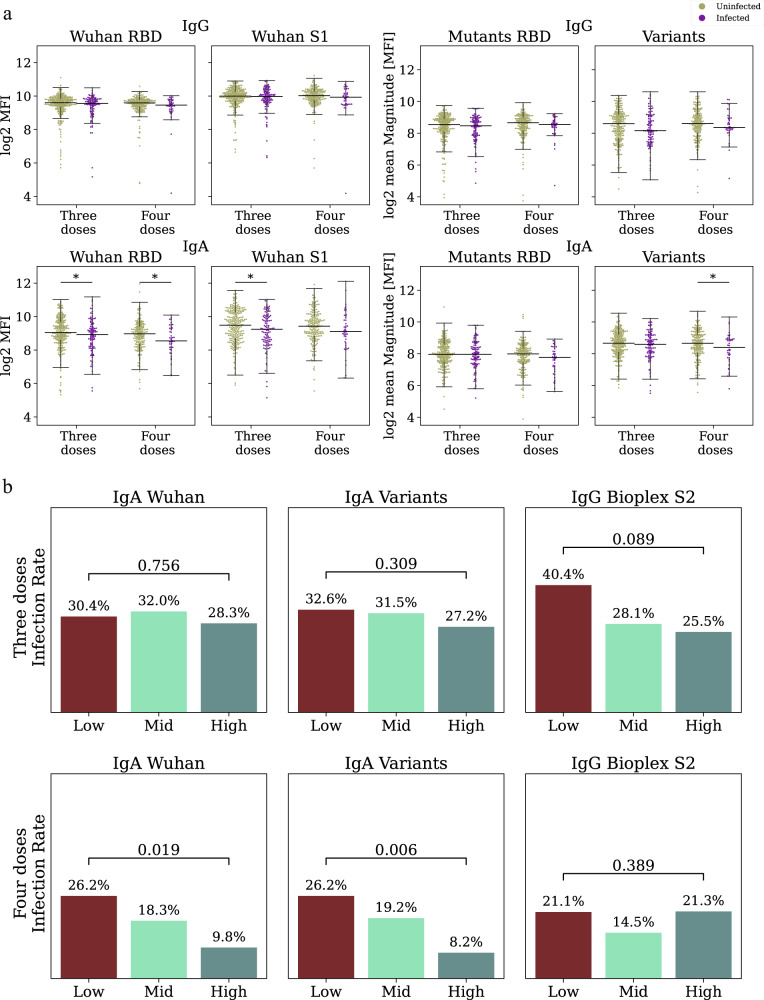
Fig. 3. Identifying baseline correlates of protection following three or four doses of the Pfizer-BioNTech vaccine.
a Antibody levels of uninfected (n = 451 brown) and infected (n = 156 purple) individuals against Wuhan, receptor binding domain (RBD) mutants and variants of concern (VOC) measured at enrollment. Black lines represent the median, and whiskers represent 1.5 times the interquartile range. P-values were computed using the two-sided wilcoxon ranksum test.*p < 0.05. b Day 30 infection rates in low- mid- and high-baseline response groups ranked by baseline binding antibodies. Comparisons were conducted for three dose (top) and four dose (bottom) recipients separately. Individuals were ranked by IgA magnitude to Wuhan (Left), IgA to SARS-CoV-2 variants (Center, Supplementary Data 5), and by IgG S2 Bioplex (Right) P-values were computed using a cox proportional hazard model, adjusted for age, occupation, medical center, and time from the third vaccination.

