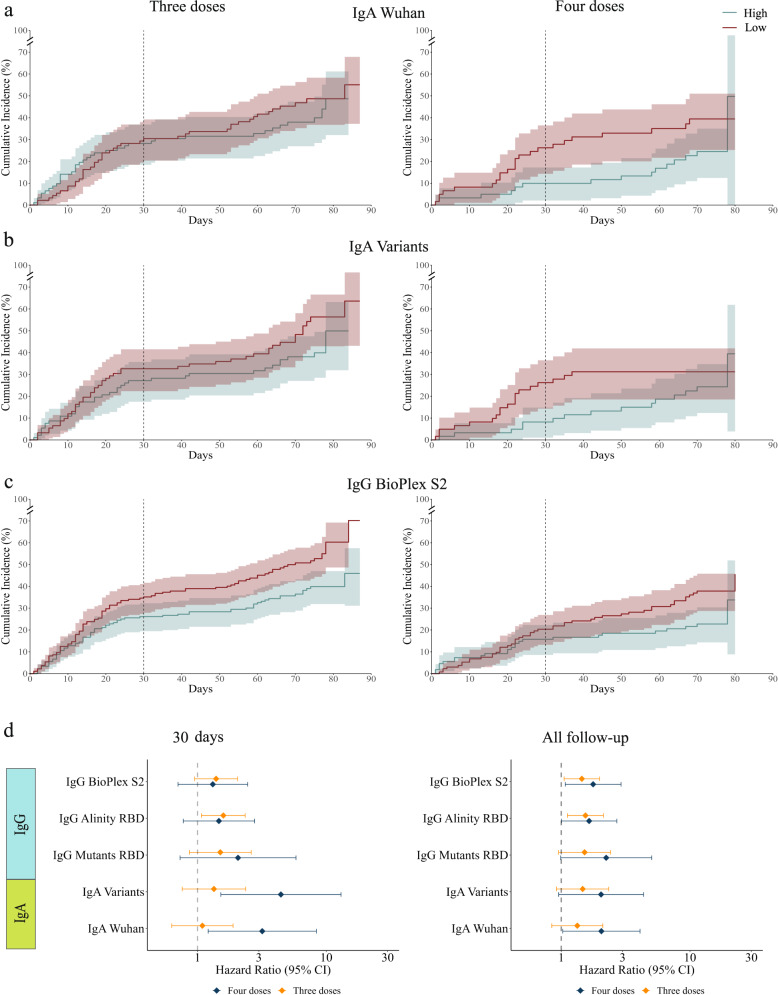
Fig. 4. Cumulative incidence plots of individuals in the low and high-baseline response groups as measured using.
a IgA response to Wuhan. The line represents cumulative incidence, and shaded bands denotes the 95% confidence intervals. b IgA response to SARS-CoV-2 variants of concern (VOC). c IgG response to the S2 protein (RAD bioplex assay). d Hazard ratios for the five primary baseline markers comparing low to high baseline response groups for individuals vaccinated with three doses n = 365 for IgG BioPlex S2 and IgG Alinity receptor binding domain (RBD), n = 184 for IgG Mutant RBD, IgA Variants and IgA Wuhan (orange) or four doses n = 242 for IgG BioPlex S2 and IgG Alinity RBD, n = 122 for IgG Mutanta RBD, IgA Variants and IgA Wuhan (blue) at day 30 (left) and the interim followup time point (right). The dot represents the hazard ratios, error bars denote the 95% confidence intervals. Hazard ratios were computed using a cox proportional hazard model adjusted for age, occupation, medical center, and time from the third vaccination.

