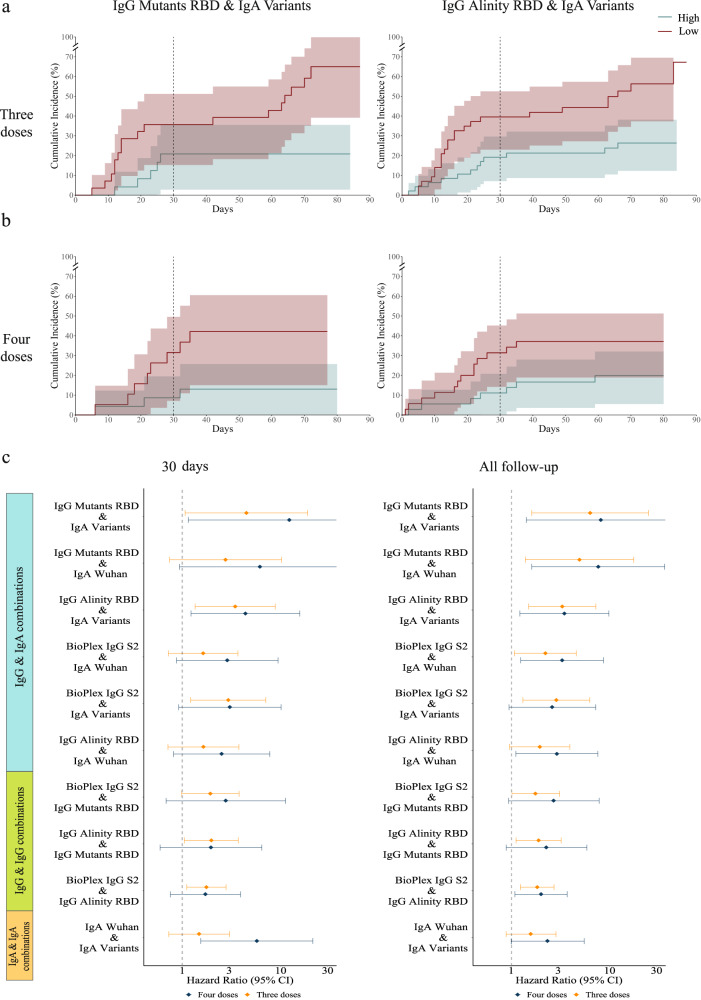
Fig. 5. Combinations of IgG and IgA baseline markers are improved baseline correlates of protection.
Pairs of baseline markers were used for ranking individuals using the intersection between the low and high groups of each baseline marker separately. Comparisons were conducted for 3rd and 4th dose recipients separately.a, b Cumulative incidence plots of individuals in the low and high- baseline response groups as measured using: a IgG receptor binding domain (RBD) mutants and IgA SARS-CoV-2 variants of concern (VOC) (four doses n = 42, three doses n = 52); and b IgG Alinity and IgA SARS-CoV-2 VOCs (four doses n = 71, three doses n = 90). The line represents cumulative incidence, and shaded bands denotes the 95% confidence intervals. c Hazard ratios comparing low to high baseline response groups using pairwise combinations of baseline binding antibody markers for individuals vaccinated with three doses (orange) or four doses (blue). The dot represents the hazard ratios, error bars denote the 95% confidence intervals. Hazard ratios were computed using a cox proportional hazard model adjusted for age, occupation, medical center, and time from the third vaccination. A number of individuals per vaccine group is different in each pairwise combination markers and is indicated in Supplementary Table 16.

