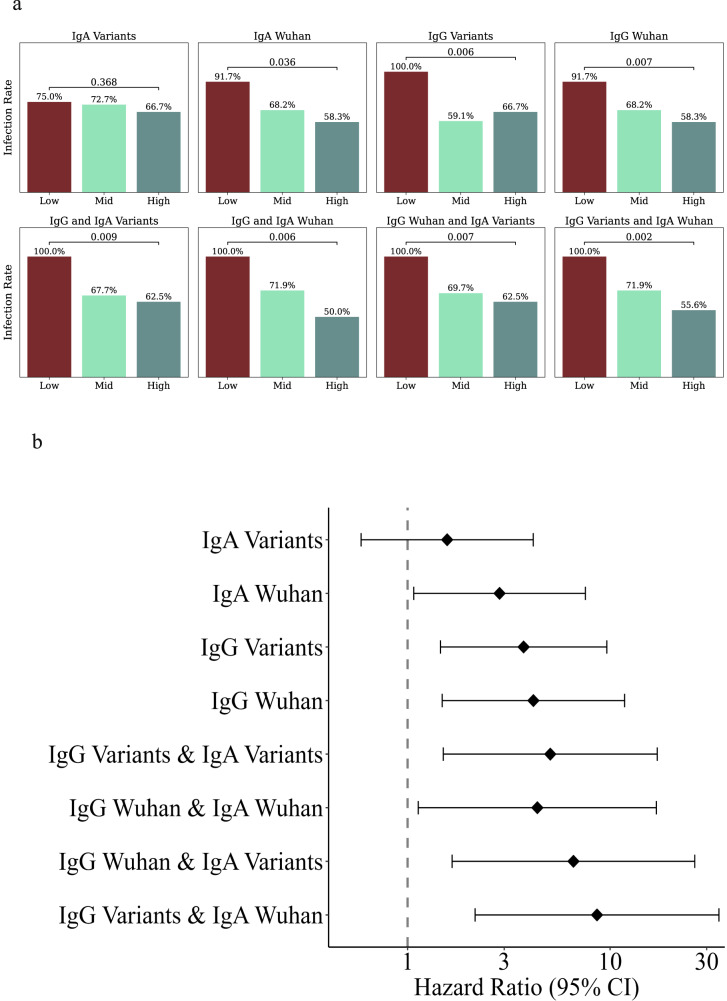
Fig. 6. Baseline correlates of protection in a validation cohort.
An independent cohort of 46 individuals was followed for 290 days. Individuals were ranked by several baseline binding antibody markers into low- mid- and high response groups, and SARS-CoV-2 infection rates of each group were compared. a Infection rates in the low- mid- and high-baseline response groups based on: IgA magnitude to SARS-CoV-2 variants including Alpha, Beta, Gamma, Delta, Iota, Kappa, Mu, Theta, and several sub-variants (see Supplementary Data 5), IgA magnitude to Wuhan, IgG magnitude to SARS-CoV-2 variants, IgG magnitude to Wuhan (top row) and their combinations (bottom row). P-values were computed using a cox proportional hazard model, adjusted for for age, sex and number of vaccine doses. b Hazard ratios for the four primary baseline markers (n = 24) and their combinations comparing low to high baseline response groups (n = 13–15). The dot represents the hazard ratios, error bars denote the 95% confidence intervals. Hazard ratios were computed using a cox proportional hazard model adjusted for age, sex and number of vaccine doses.

