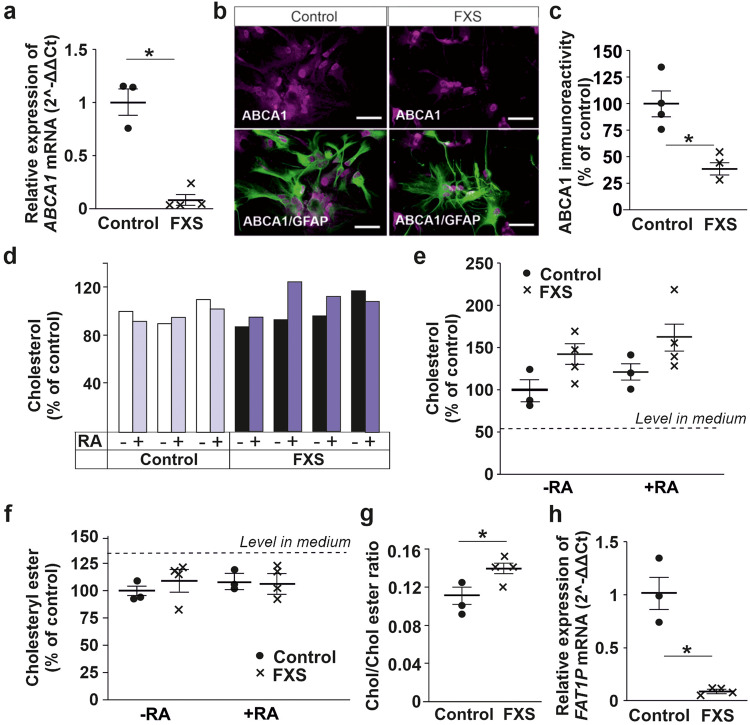
Fig. 1. Expression of cholesterol efflux transporter ABCA1 and extracellular cholesterol in human iPSC-derived FXS and control astrocyte cultures.
a Expression of ABCA1 mRNA in human control and FXS astrocytes; n(Control) = 3 cell lines and n(FXS) = 4 cell lines (3 biologically independent cell lines). b Immunofluorescence images showing ABCA1 (red) and GFAP (green) in control and FXS astrocytes, scale bar 50 μm. c Relative ABCA1 protein expression in control and FXS astrocytes; n(Control) = 241 cells and n(FXS) = 285 cells on 3–4 cultures/each cell line (4 control and 3 FXS cell lines). d Relative abundance of total cholesterol in astrocyte-conditioned medium (ACM) of control (HEL23.3, HEL24.3, and HEL46.11 cell lines from left to right, respectively) and FXS (HEL69.6, HEL70.3, HEL70.6, and HEL100.2 cell lines from left to right, respectively) astrocytes under basal conditions and after retinoic acid (RA) treatment. e Relative abundance of cholesterol and f cholesteryl esters in control and FXS ACM in LS-MS-based lipidomics analysis; n(Control) = 3 cell lines and n(FXS) = 4 (3 biologically independent cell lines). Dashed line shows cholesterol (e) and cholesteryl ester (f) levels in cell-free medium. g Ratio of cholesterol/cholesteryl ester relative abundance in control and FXS ACM under basal condition. h Expression of FAT1P in human control and FXS astrocytes; n(Control) = 3 cell lines and n(FXS) = 4 (3 biologically independent cell lines). Data are shown as mean ± SEM. The two-sided t-test was applied to evaluate the statistical differences; *P < 0.05.

