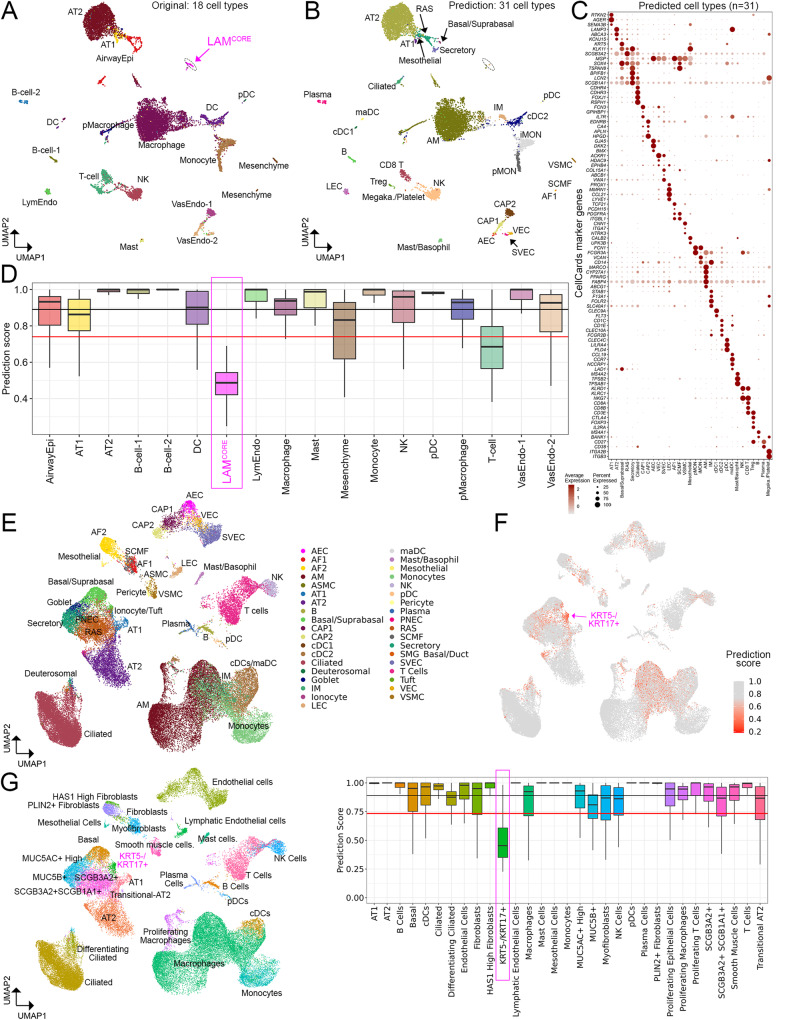
Fig. 6. Application of LungMAP Human Lung CellRef to disease lungs.
A UMAP visualization of a published scRNA-seq of human lungs with LAM1. Cell colors represent cell identities predicted in Guo et al., 2020, including a unique disease-related cell population, named LAMCORE cells (magenta cell cluster). B UMAP visualizations of cells predicted using the CellRef Seed as reference. Basal and suprabasal cells were combined in the prediction. Prediction scores (between 0 and 1) were calculated by the Seurat v4 MapQuery function for each cell. Cells with prediction score >= the default cutoff (i.e., the mean minus 1 standard deviation value) were shown. Three singleton cell type predictions were not included. C Evaluation of cell type predictions using expression of representative CellRef marker genes. Megaka./Platelet: Megakaryocyte/Platelet. D Distributions of the cell type prediction scores in each of the original cell identities (n = 18 cell types; abbreviations were defined in Guo et al.1). The black and red horizontal line represents the mean and (1 standard deviation lower than the mean) value of the prediction scores, respectively. E–G UMAP and boxplot visualizations of application of CellRef to a published scRNA-seq of human lungs with idiopathic pulmonary fibrosis (IPF)11. E UMAP visualization of cells predicted using the CellRef Seed. Basal and suprabasal were combined, T cell subsets, and monocyte subsets were combined in the prediction. F UMAP visualization of cells colored by the prediction scores. G Left: UMAP visualization of cells colored by the original cell identities (n = 31 cell types; abbreviations were defined in Habermann et al.11). Right: boxplot visualization of the distribution of prediction scores in each of the original cell identities. The black and red horizontal line represents the mean and (1 standard deviation lower than the mean) value of the prediction scores, respectively. The disease-associated KRT5-/KRT17+ cells had prediction scores below the cutoff line. The number of data points in each boxplot in (B) and (G) can be found in Fig. 6 source data table. In (D) and (G), Box center lines, bounds of the box, and whiskers indicate medians, first and third quartiles, and minimum and maximum values within 1.5×IQR (interquartile range) of the box limits, respectively. Please see Fig. 2 for definitions of CellRef cell type abbreviations.

