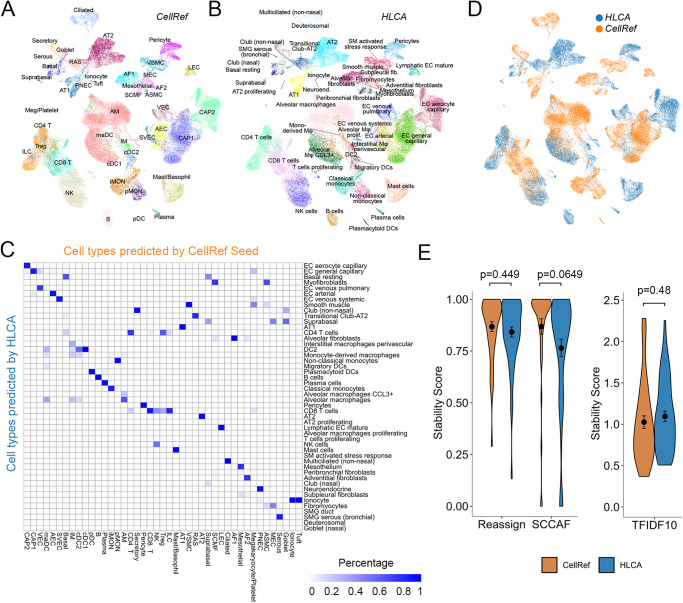
Fig. 8. Assessment of cell type stability of automated annotation using CellRef.
A, B UMAP projection of scRNA-seq (Travaglini et al.15, n = 3 human lungs) with Azimuth projected cell type annotations using the LungMAP Human Lung CellRef Seed (A) or using the Human Lung Cell Atlas (HLCA)37 (B) as the reference. C Corresponding cell-population assignments of CellRef and HLCA (mapping percentage relative to CellRef). D Cells colored by “winning” annotations from CellRef or HLCA determined by scTriangulate based on stability assessments (shown in E) annotations. E Violin plot visualization of stability metric scores calculated using scTriangulate, including reclassification accuracy (SCCAF and reassign) or marker gene specificity (TF-IDF score), for all Azimuth assigned CellRef or HLCA cell populations (n = 42 cell populations predicted using the CellRef Seed; n = 48 cell populations predicted using HLCA) in Travaglini et al. 2020. The black dots and error bars represent mean ± SEM. p value represents significance of difference assessed using two-tailed unpaired Welch’s t test. Please see Fig. 2 for definitions of CellRef cell type abbreviations.

