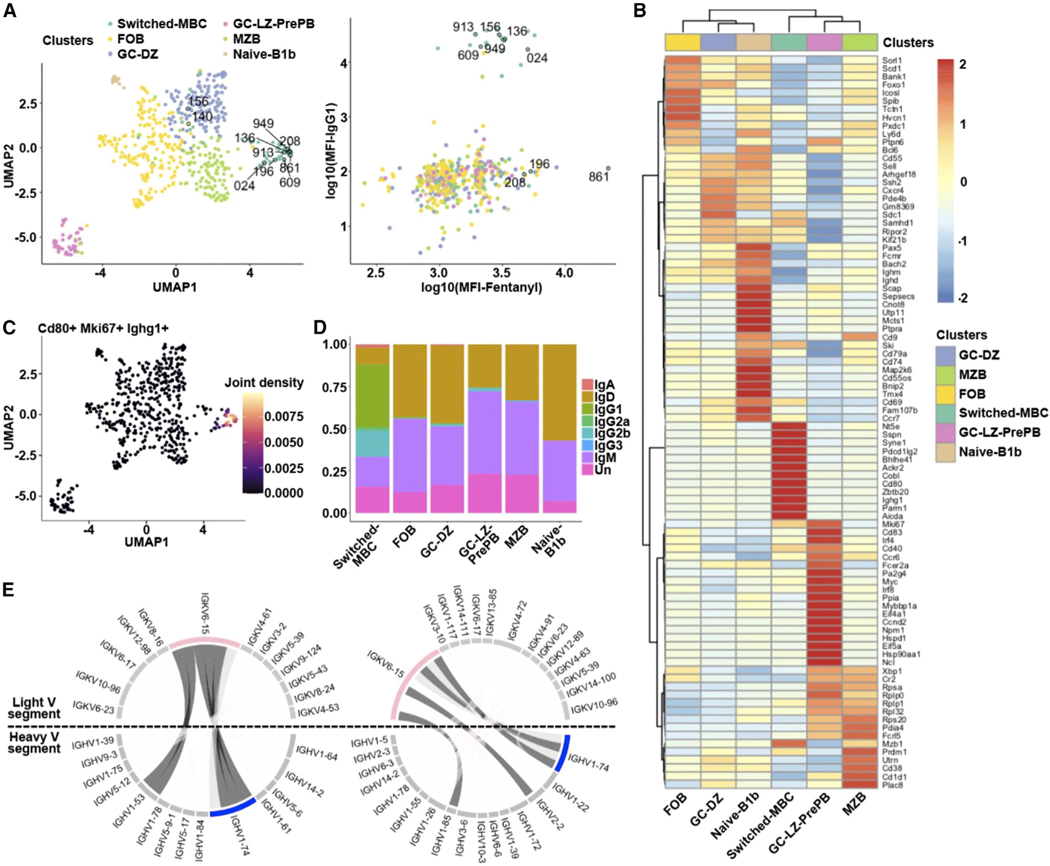
Figure 4. The VAST platform elicits six different B cell subsets.
(A) Uniform manifold approximation and projection (UMAP) visualization of the B cell subclusters and scatterplot of the log10(mean fluorescence intensity) (MFI) for the fentanyl binding vs. the IgG1 surface expression is shown. The color code indicates the different subclusters. The numerically labeled cells correspond to the B cells from which the BCRs were cloned to produce Fabs and full-length antibodies.
(B) Heatmap visualizing the top 10 statistically significantly upregulated genes based on the MAST statistical framework for each subcluster along with several known B cell markers. Genes with an adjusted p value <0.05 have been identified as markers. The columns correspond to the different subclusters (the same color code used in A) and the rows to the average gene expression for the selected genes. Red indicates relatively high gene expression, while blue indicates low expression.
(C) UMAP visualization of the joint expression of the Cd80, Mki67, and Ighg1 genes. Beige indicates a relatively high simultaneous expression pattern, while purple indicates low simultaneous expression.
(D) Barplot depicts the heavy-chain isotype distribution for each B cell subpopulation. There are cells (labeled as Un [unknown]) for which we were unable to identify the isotype via BLAST.
(E) Circos plots of the switched memory B cell subpopulation for each of two mice are shown. The expanded heavy (in blue, IGHV1–74) and light (in pink, IGKV6–15) variable chain genes are highlighted. Dark gray: BCRs that were selected for cloning.
See also Figure S4.

