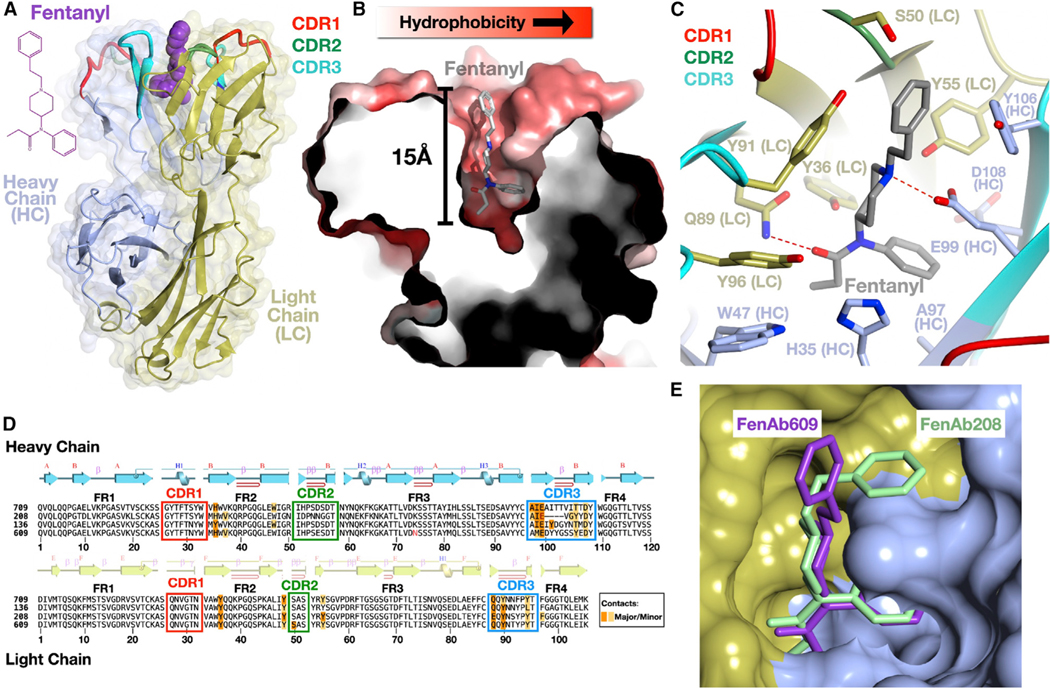
Figure 6. VAST-elicited antibodies bind fentanyl in a deep, enveloping pocket.
(A) Overall structure of a complex of a Fab (FenAb609, heavy chain colored light blue, light chain colored gold) with fentanyl (purple, space filling depiction) shown as a ribbon diagram with the two-dimensional chemical structure of fentanyl on the left.
(B) Illustration of the fentanyl binding pocket as a thin slice through the molecular surface of the protein (colored in a gradient from white to red to reflect increasing hydrophobicity of the surface) colored using the method of Eisenberg.57 Fentanyl is shown as a stick model with atoms of carbon, nitrogen, and oxygens in gray, blue, and red, respectively.
(C) Contacts of the protein to fentanyl shown with side chains as stick models and the mainchain as a ribbon diagram. “HC” denotes heavy chain, and “LC” denotes the light chain. Hydrogen bonds are shown as dashed red lines between bonded atoms.
(D) Sequences of four fentanyl-binding Fab molecules where the alignment was generated by superimposing the crystal structures. The secondary structure of a representative Fab (FenAb609) is shown above the sequence, colored as per (A). Disulfide bonds are shown as lines connecting cysteine residues. Major and minor contacts are indicated in orange and yellow, respectively. The framework regions are denoted as FR1, −2, −3, and −4.
(E) Superposition of FenAb609 and FenAb208 crystal structures with the molecular surface of FenAb208 shown (heavy and light chain regions colored as in A) along with the stick figures of fentanyl in both molecules.
See also Figure S6.

