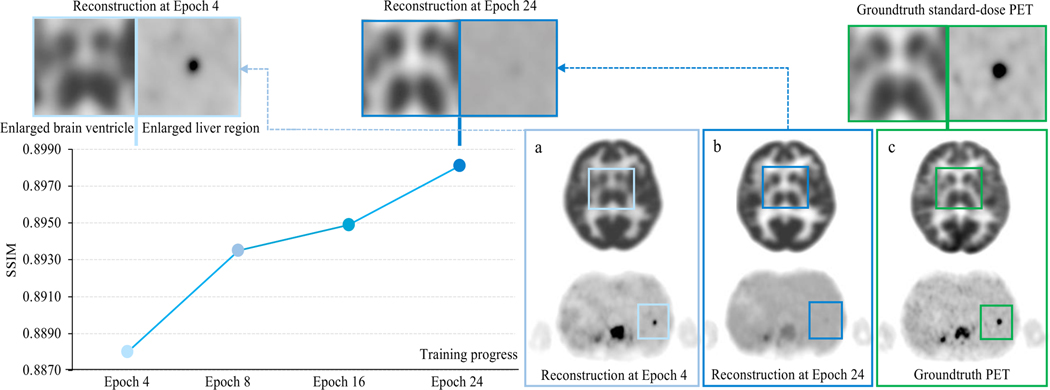
Figure 5: Representative discrepancy in reconstruction quality between different anatomical regions over the course of model training.
SwinIR is the model of choice for this demonstration. The performance is based on the primary Stanford PET/MRI cohort. The line chart shows the SSIM metric of the Stanford validation set over models at different training epochs. PET images illustrate cases from the Stanford testing set. The patches (top panel) are enlarged crops of a, b, and c, respectively. As the training progresses from epoch 4 to epoch 24, the structure of the basal ganglia within the brain becomes better reconstructed, while the small lesion (less than 1 cm3) within the liver gets over-smoothed.

