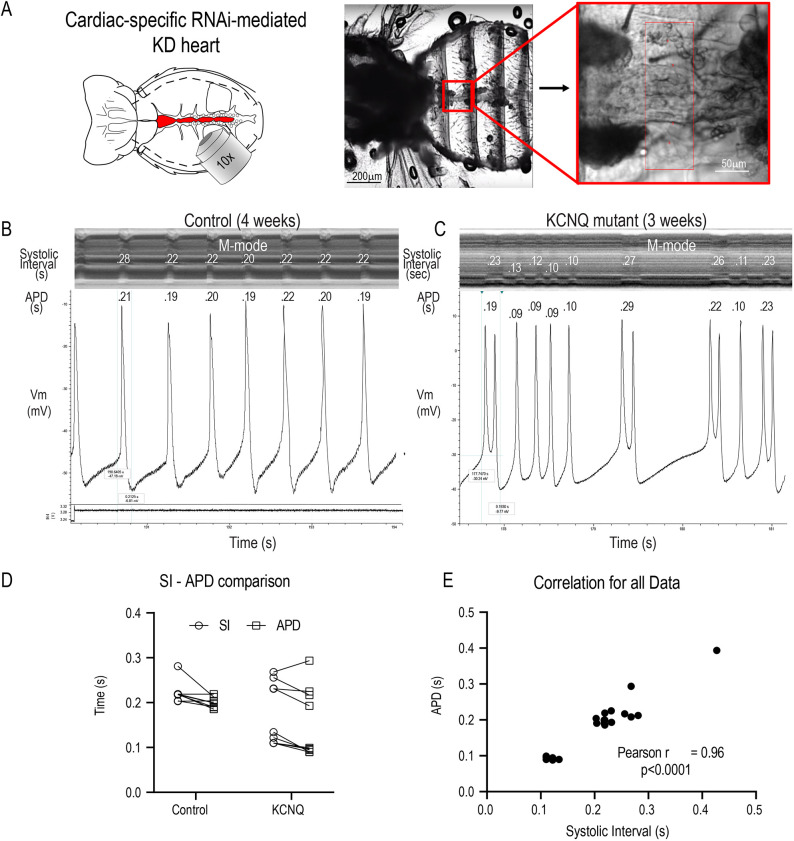
Fig. 2.
Fly heart platform. (A) Schematic of the fly thorax and abdomen (left; heart tube is shown in red) and image of semi-intact preparation (middle) with a single cardiac chamber (red box), shown at higher magnification on the right. KD, knockdown; RNAi, RNA interference. (B,C) Simultaneous optical and electrophysiological recordings from beating hearts. M-modes from optical recordings are shown at the top with the corresponding AP traces below. APDs and systolic intervals (SIs) are shown in seconds. The lower window in B shows the voltage trace generated by the image capture software that was used to synchronize the optical and electrical recordings. (D) SIs are paired with their corresponding APs. (E) The Pearson correlation coefficient for the combined data in D showed a significant correlation between SIs and APDs (r=0.96, P<0.0001).

