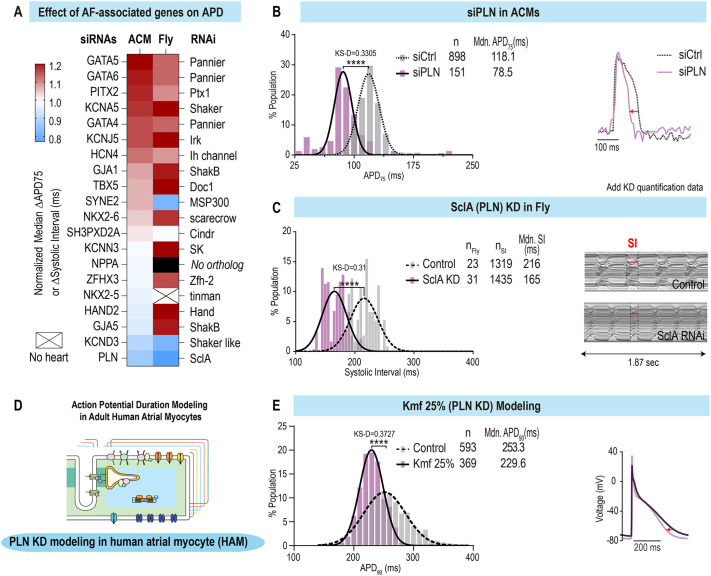
Fig. 3.
Loss-of-function screen of atrial fibrillation (AF)-associated genes identifies conserved modulators of APD and SI in a multi-model system platform. (A) Heatmap showing the normalized effects of AF-associated gene loss of function on APD and SI in ACMs and flies. (B) Population distribution of APD75 values for siControl and siPLN-transfected ACMs (left) and representative AP traces (right) showing the shortening effect of siPLN. Mdn, median. (C) Population distribution of SIs in control versus SclA KD conditions in flies (left) and representative M-modes (right), showing the SI shortening effect for SclA KD. (D) Schematic representation of APD modeling in human atrial monocytes (HAMs). (E) Population distribution of APD90 values for control and Michaelis constant (Km) of SERCA to cytosolic Ca2+ (forward pumping) (Kmf) 25% (PLN KD) in HAMs (left) and representative AP traces (right), showing the shortening effect on APD of simulated PLN KD. ****P<0.0001 (KS-D).

