
Figure 1. Molecular and anatomical characterization of medial habenula cell types.
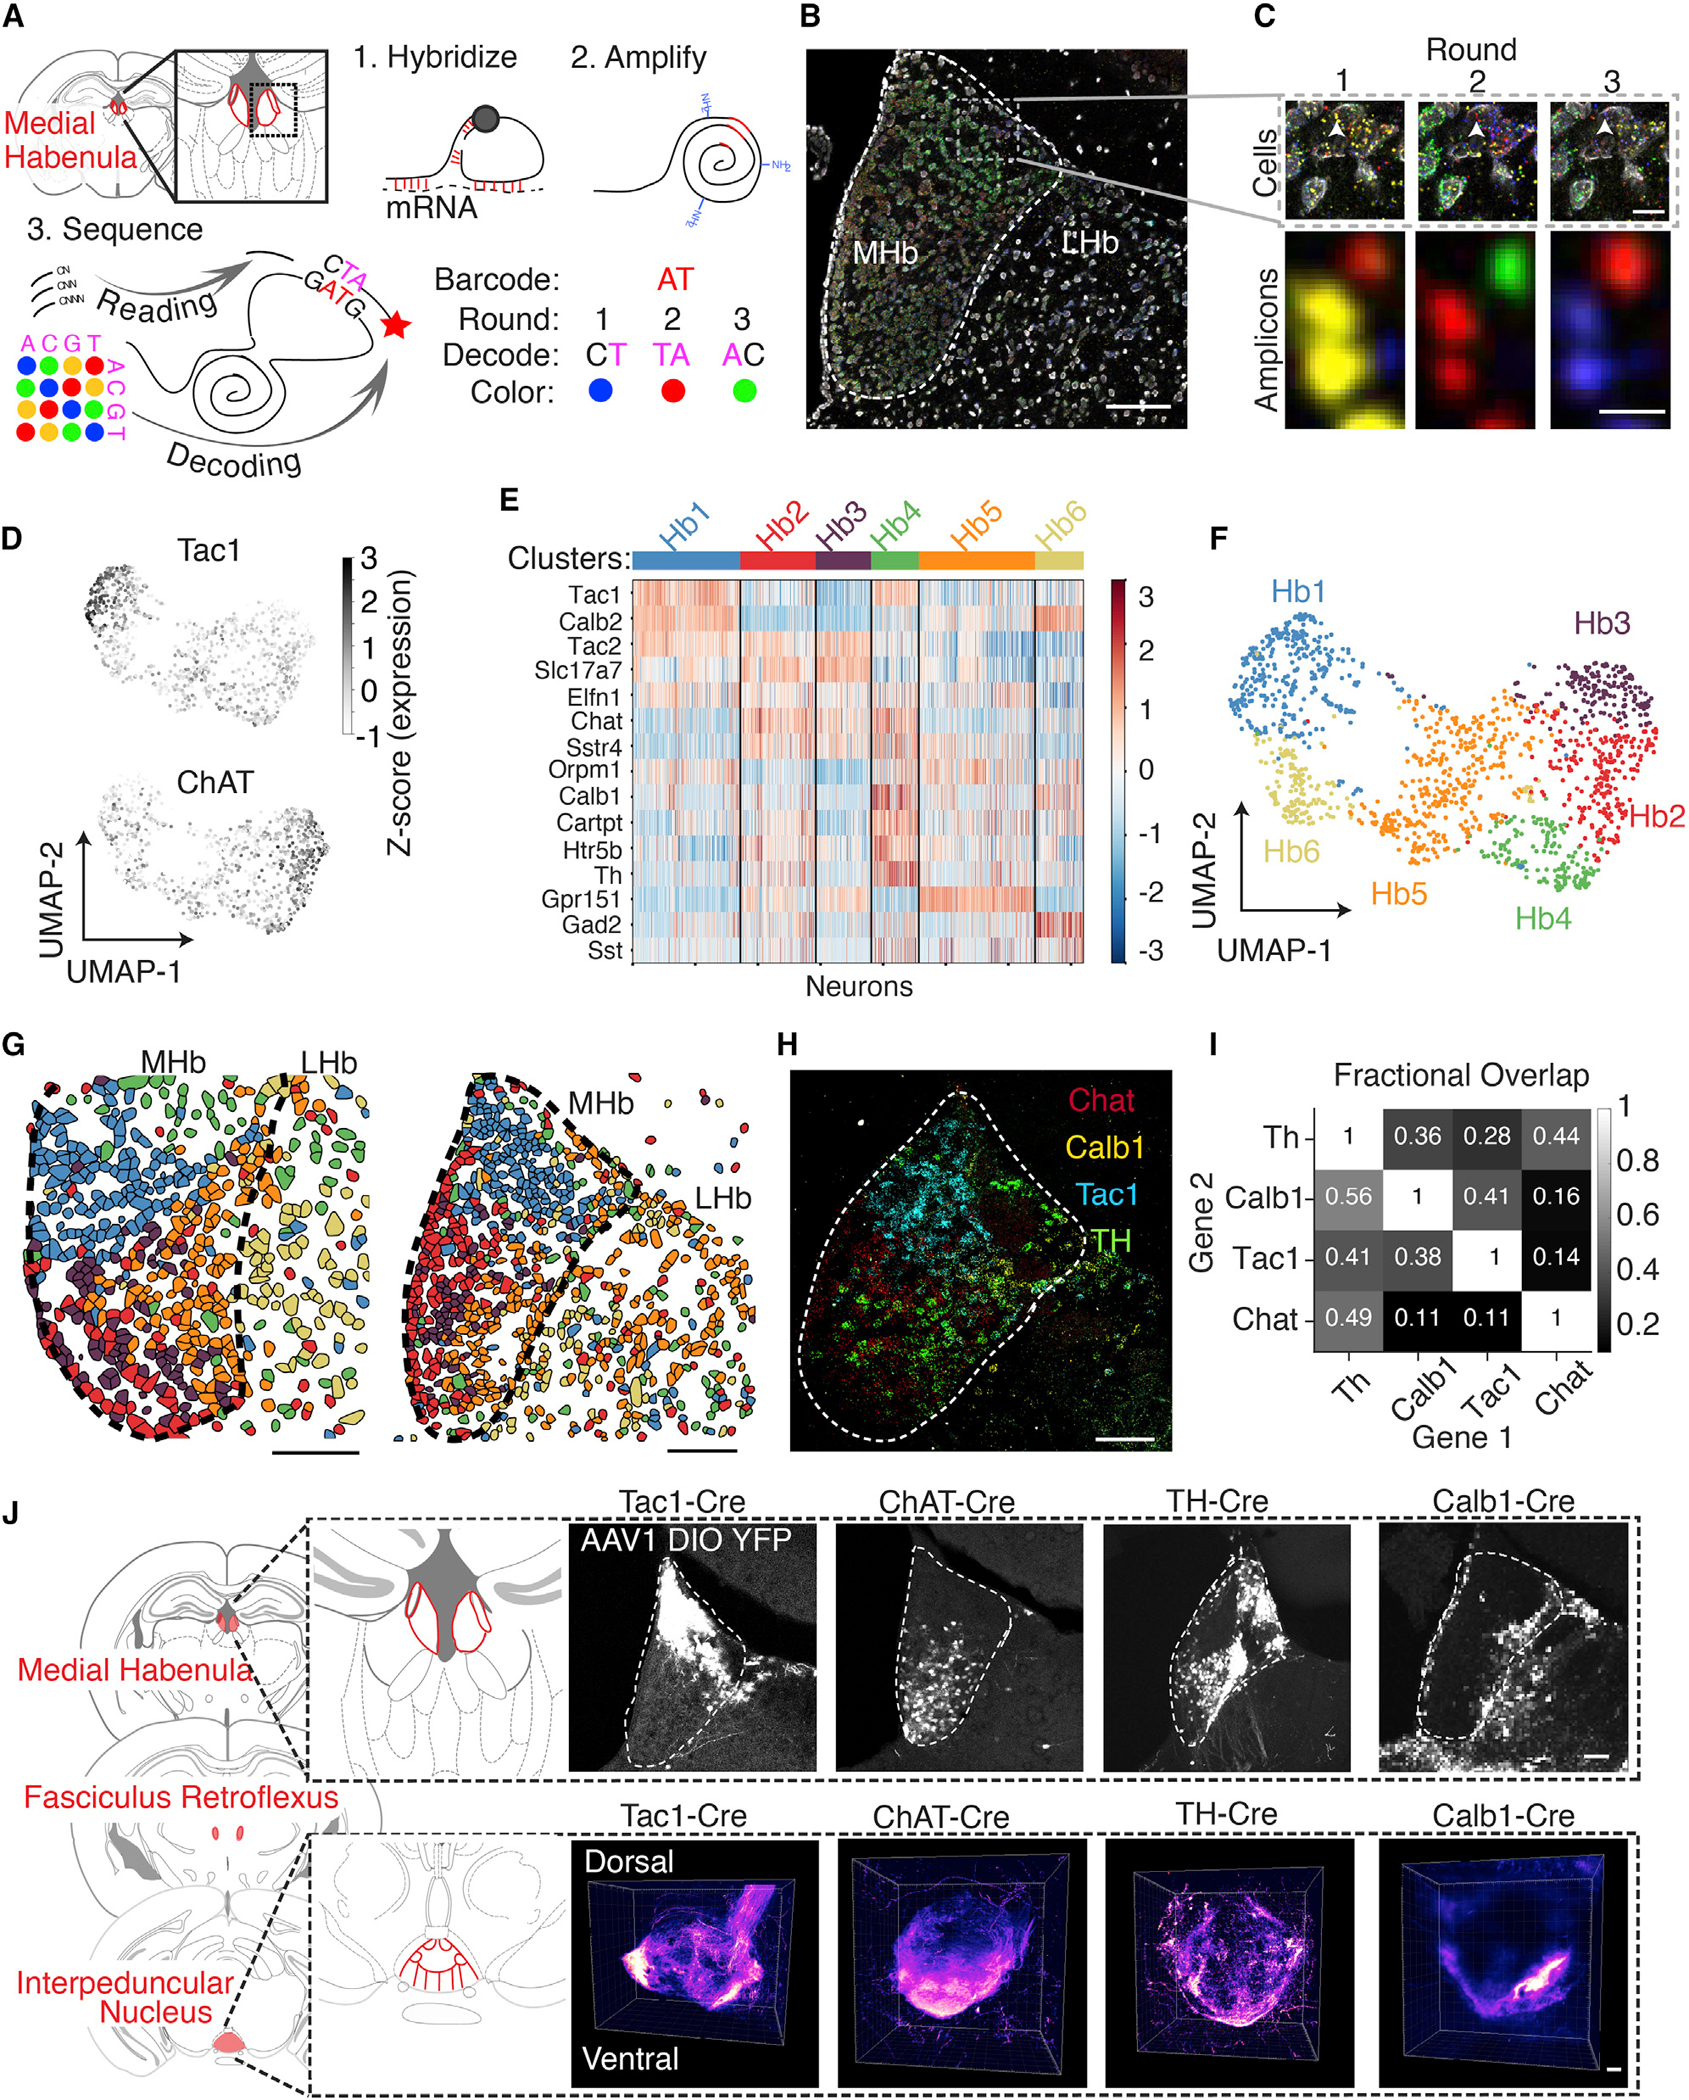
(A) Experimental design for 3 rounds of STARmap in situ sequencing of 15 genes in the habenula (Hb). Barcoded probes hybridize to mRNA targets and undergo rolling circle amplification. Sequential hybridization decodes each base on two adjacent rounds (STAR Methods).
(B) Deconvolved image from one round of in situ sequencing of Hb tissue. Dashed line indicates MHb boundaries. Box indicates ROI in (C). Scalebar: 100 μm.
(C) Top, magnified view of dotted box in (B) across 3 rounds of imaging. Scale bar: 10 μm. Bottom, magnified view indicated by arrow in top panels. Scale bar: 1 μm.
(D) Uniform manifold approximation projection (UMAP) of the expression of 15 genes for 1440 segmented Hb neurons from 2 biological replicates. Grayscale indicates the Z scored expression of Tac1 and Chat.
(E) Heatmap of expression levels of each gene (row) for each cell (column), color bar indicates Z score for each gene across all clusters.
(F) UMAP projection of all neurons. Color indicates cluster identity.
(G) Clusters identified in (F) are mapped onto the position of each cell in the Hb for two biological replicates. Scale bar: 100 μm.
(H) Quadruple in situ hybridization of Tyrosine Hydroxylase (Th), Tachykinin1 (Tac1), Choline Acetyltransferase (Chat), and Calbindin1 (Calb1) mRNA. Scale bar: 100 μm.
(I) Quantification of overlap in (H). Grayscale indicates the proportion of cells expressing Gene 1 that also express Gene 2. Fractional overlap listed inside each box. n = 3639 neurons.
(J) Left, coronal sections from mouse atlas showing the axonal projections from the medial Hb to the interpeduncular nucleus (IPN) (Konsman, 2001). Top right, neurons expressing AAV1-DIO-EYFP in X-Cre animals in the Hb, with α-GFP immunostaining. Bottom right, 3D rendering of YFP+ IPN axons of X-Cre:DIOYFP animals after tissue clearing (~3-mm-thick sections, pseudocolored for YFP intensity).
Scale bars: 100 μm.
See also Figure S1.