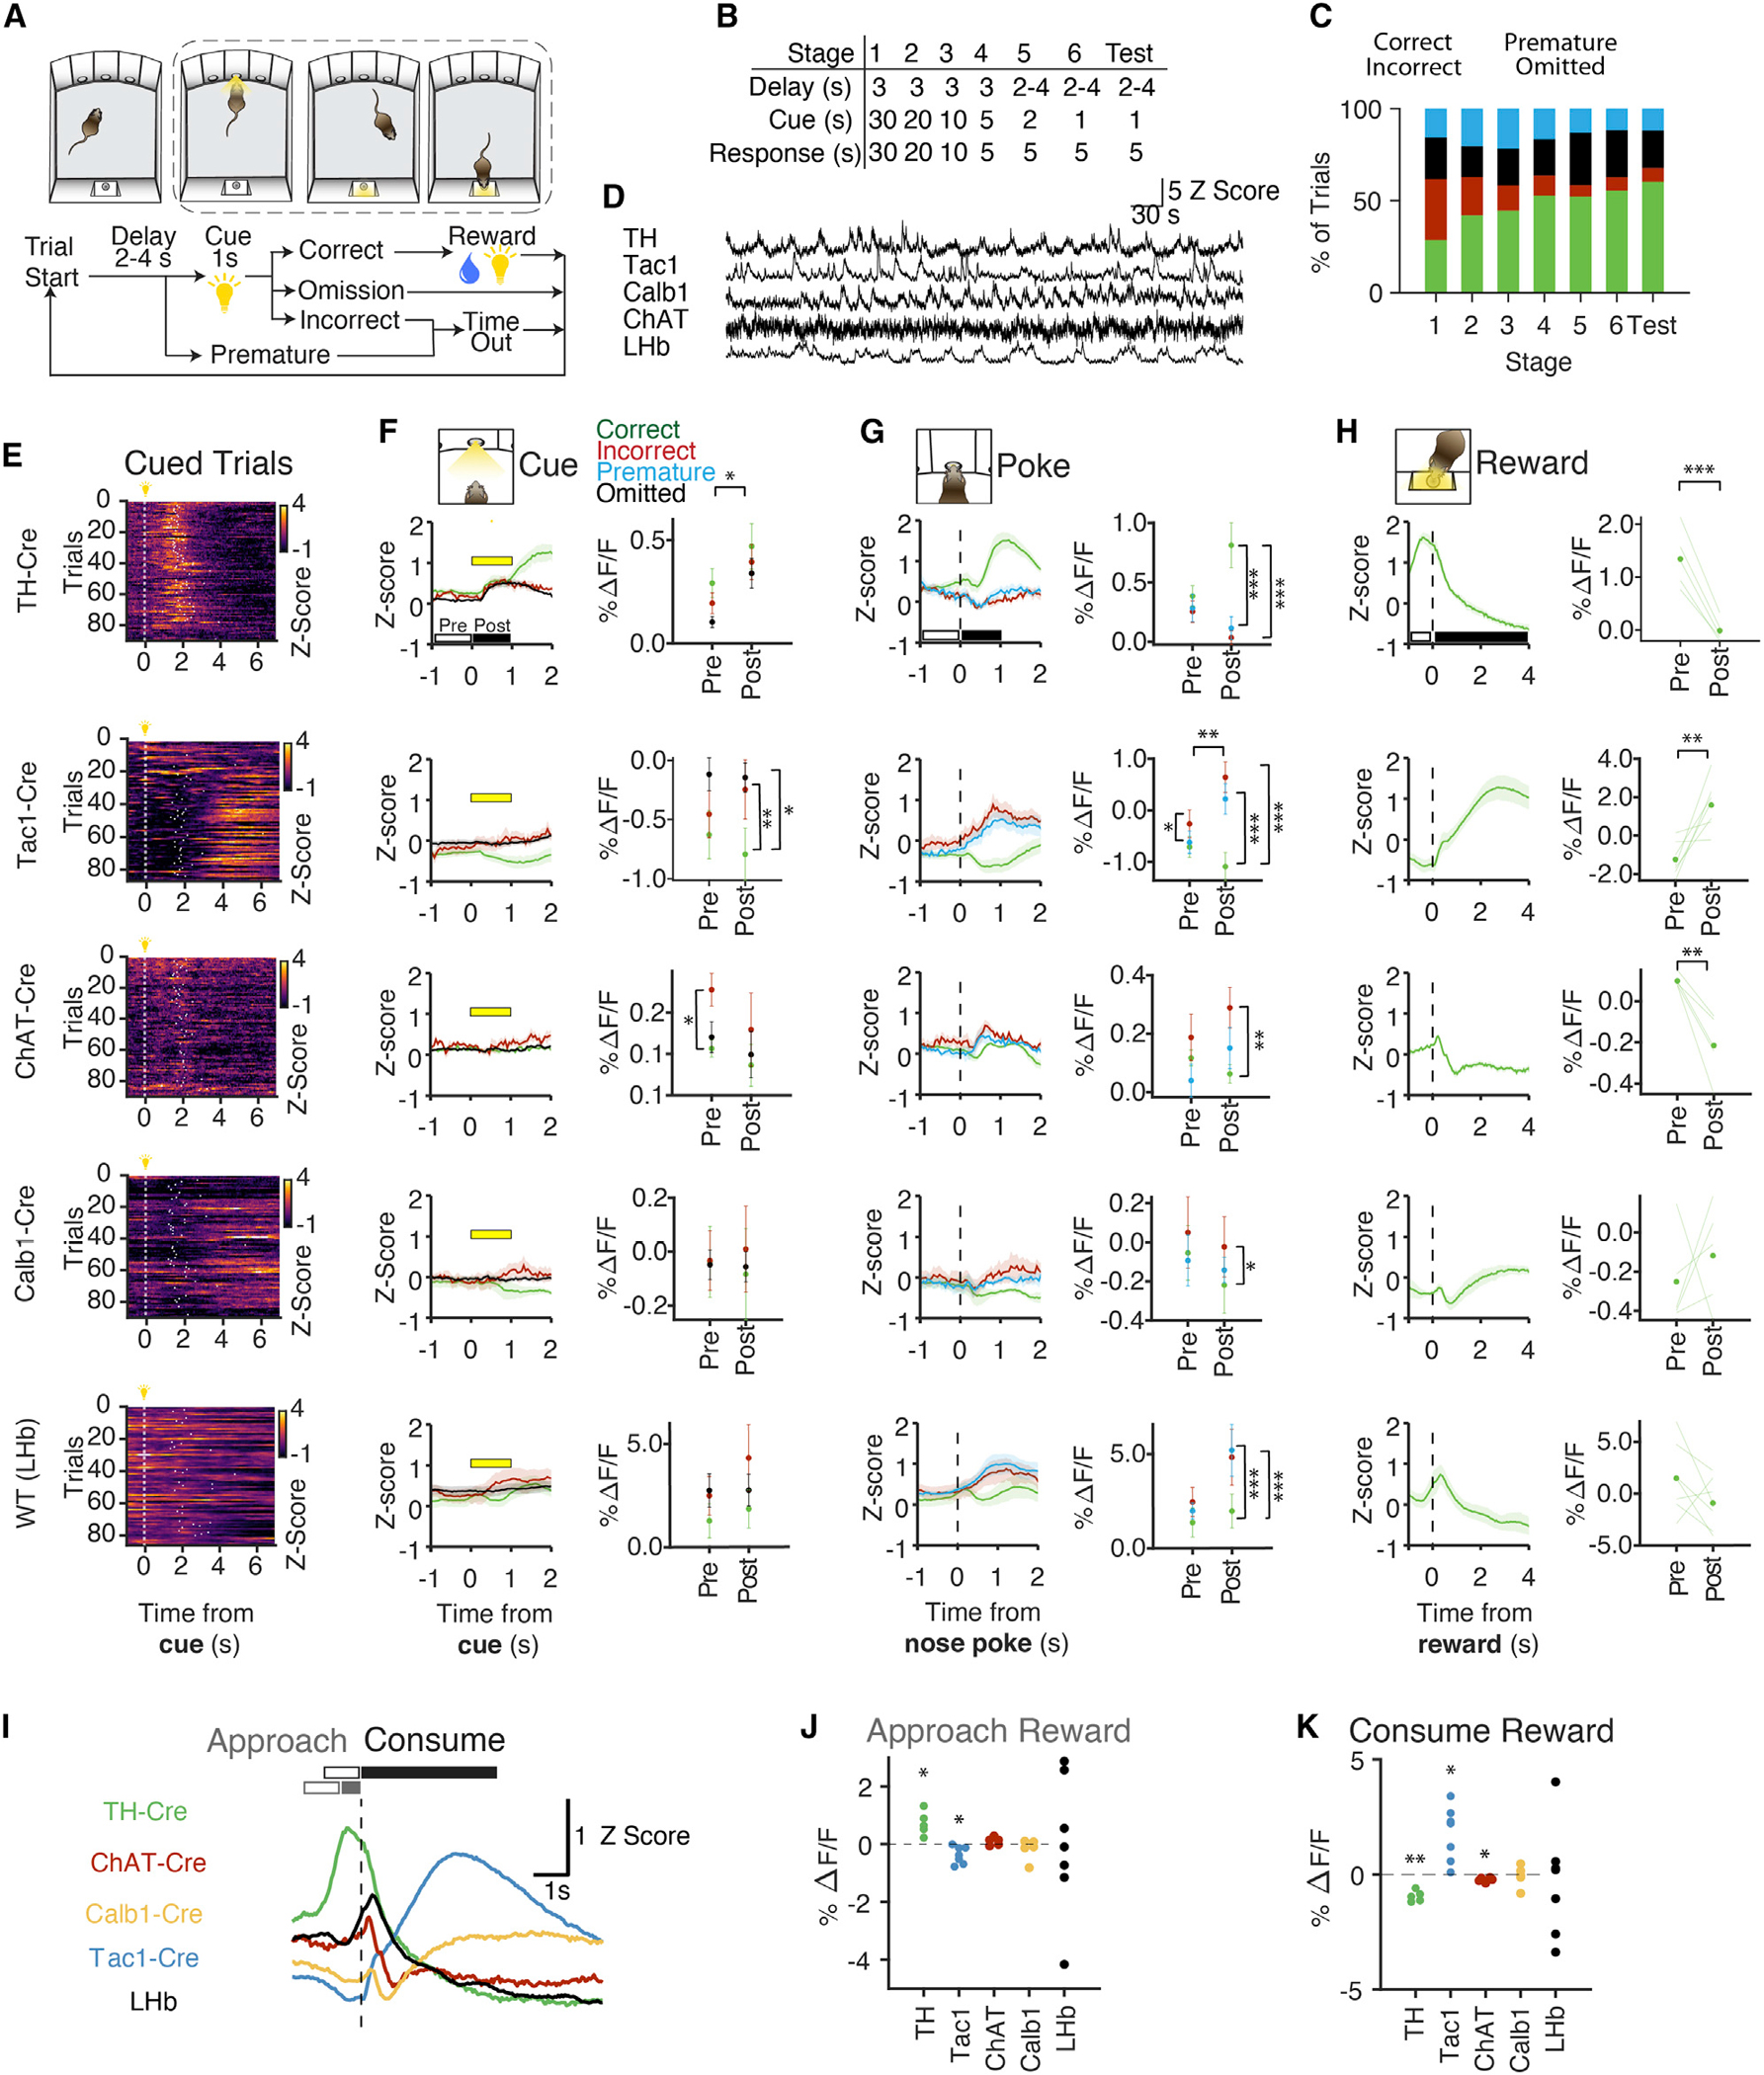
Figure 2. Habenular cell types show distinct reward-related activity.

(A) Trial structure of 3-Choice Serial Reaction Time Task. After a variable delay, a cue light appears in one of three nose pokes for 1 s. Nose pokes into the lit port result in delivery of sucrose water at the reward port on the opposite wall. Premature and incorrect trials result in a 5 s time out.
(B) Training consists of 6 stages of progressively shorter cue durations and the introduction of a variable delay.
(C) Behavioral performance across training. Percentage of correct (green), incorrect (red), omitted (black), and premature responses (blue) for all animals (n = 29 mice).
(D) Example traces from photometry recording during behavior, Z scored across each session.
(E) Example photometry recordings from one behavioral session per genotype. Each row represents a single trial where t = 0 is cue onset. Color: Z scored fluorescence. Data from premature and omitted trials are not displayed.
(F–H) Left panels, photometry time series normalized to 405 nm control, Z scored across each session, and aligned to cue onset, nose poke, or reward port entry. Data is separated by behavioral outcome: correct (green), incorrect (red), omitted (black), and premature (blue). Error bars indicate SEM. Right panels, %ΔF/F calculated before and after the cue (F) or nose poke (G). Two-way ANOVA with repeated measures correction. Cue effect: Th+, p < 0.05. Nose poke effect: Tac1+, p <0 .01. Trial outcome vs cue: Tac1+, p < 0.05. Trial outcome versus nose poke: Th+, p <0 .01; Tac1+, p <0 .001; ChAT+, p < 0.05. See Table S1 for multiple comparisons. For reward (H), Th+, p <0 .001, Tac1+, p <0 .01, ChAT+, p <0 .01 by paired t test.
(I) Summary of mean Z scores for each genotype in (H), aligned to reward port entry.
(J and K) Quantification of the change in GCaMP fluorescence at reward approach or reward consumption with a one-sample t test with FDR correction. For reward approach: Th+, p < 0.05 and Tac1+, p < 0.05. For reward consumption, Th+, p < 0.01, Tac1+, p < 0.05, ChAT+, p < 0.05. In all panels, black bars indicate the time periods analyzed before (open) and after (filled) behavioral events. Data represents average across mice: Th-Cre, n = 5 mice; Tac1-Cre, n = 7 mice, ChAT-Cre, n = 5 mice, Calb1-Cre, n = 5 animals; LHb, n = 7 animals.
Error bars: SEM.
