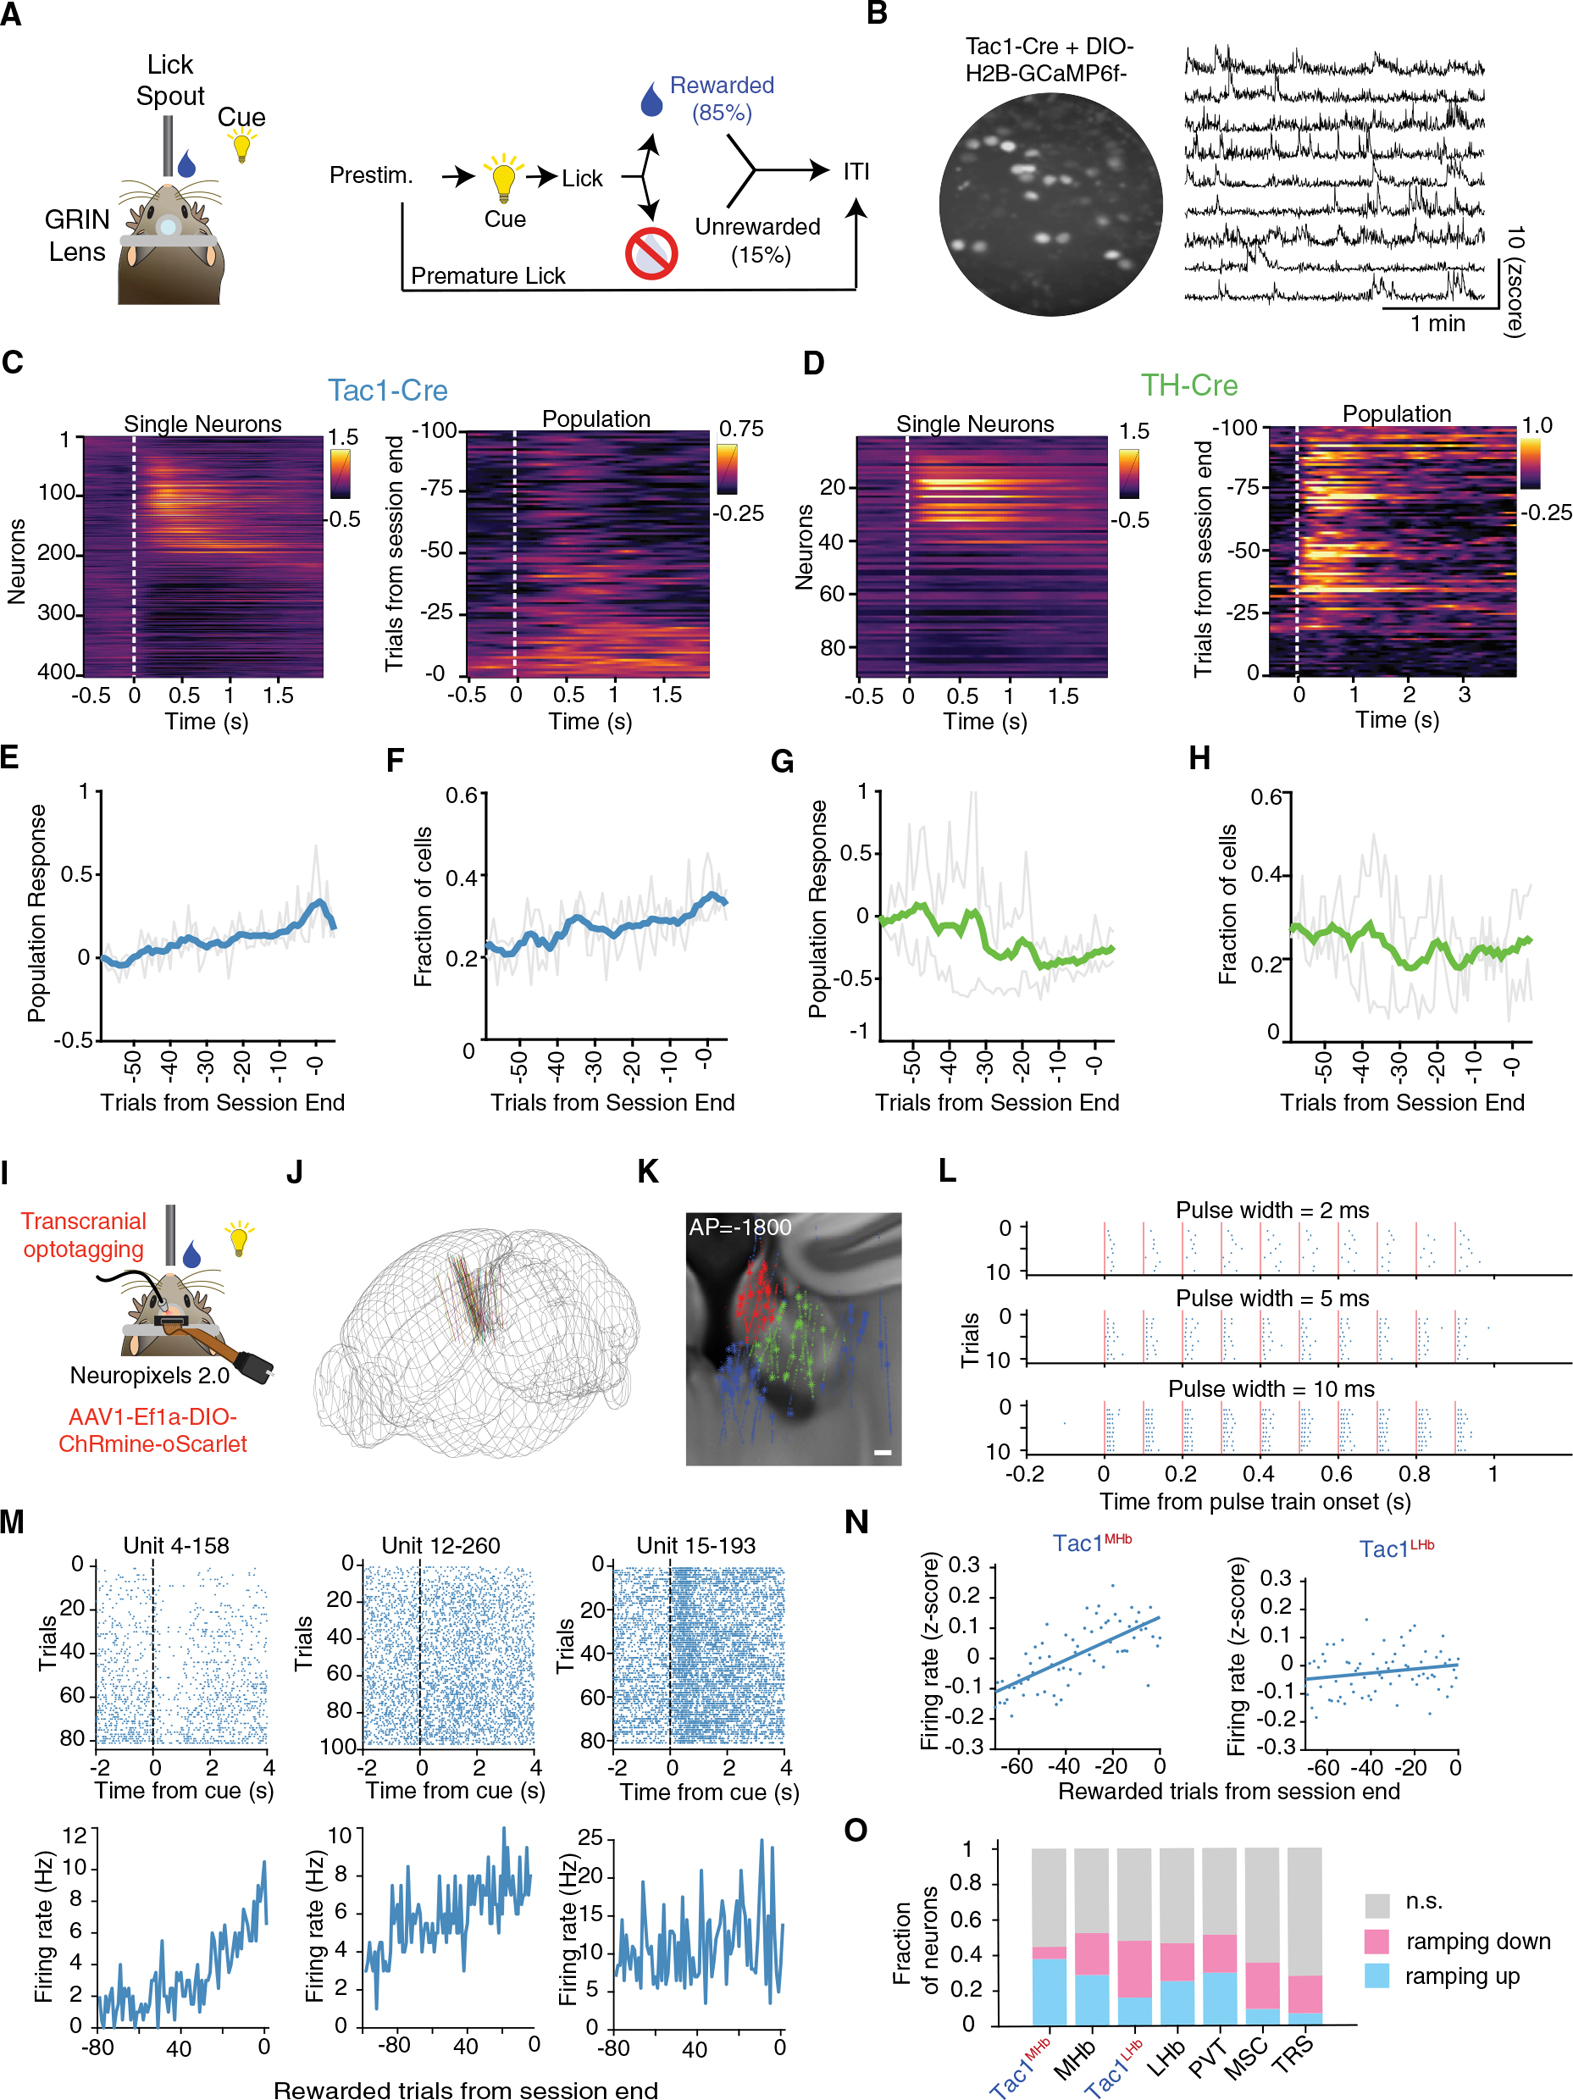
Figure 5. Cell-type-specific imaging and electrophysiology reveals distinct long-timescale dynamics at single-neuron and population level.

(A) A simplified reward task for head-fixed calcium imaging and electrophysiology. During a 0.5 s prestimulus period, animals must withhold licking. During a 1 s cue period, licks are rewarded with sucrose water delivery. In 15% of trials, earned rewards are withheld. Trials are separated by a variable ITI.
(B) Example 2p image of Tac1MHb neurons expressing H2B-GCaMP6f, imaged through a 600 μm GRIN lens. Right, example traces from Tac1MHb neurons.
(C–D) Heatmap showing (left) Z scored, trial-averaged activity from single Tac1MHb (C) or TH+ (D) neurons on rewarded trials. Neurons from 2 mice are included in each panel. (right) Heat maps from one example animal showing population activity (sum of fluorescence across all neurons) for each trial in one session (right). (E and G) Activity of reward-responsive neurons during the reward period over a behavioral session in Tac1MHb and TH+ neurons, respectively. Data normalized to the first trial shown. Mean (bold line) and individual mice (gray lines). Across the session, Tac1MHb populations showed stereotyped and statistically significant increasing population activity (p = 1.7×10⁻²²) and TH+ populations showed more variable and slightly decreasing population activity (p = 3.6×10⁻⁵); p values for the null hypothesis that the slope of linear regression is zero.
(F and H) The proportion of reward-responsive cells over the session in Tac1MHb and TH+ mice, respectively. A responding cell is defined as a cell with a Z score greater than 0.25 for the 1 s reward period. Across the session, Tac1MHb neurons show a statistically significant increase (p = 6.4×10⁻¹⁵) and TH+ neurons show a statistically significant decrease (p = 5.8×10⁻⁴) in the fraction of active neurons.
(I) Experimental configuration for Neuropixels 2.0 recording. A 4-shank probe was approached at 10 from the midline. A 637 nm laser was illuminated above the skull.
(J) Summary of Neuropixels probe insertions targeting MHb. n = 7 animals, 18 behavioral sessions.
(K) Spatial position of recorded single neurons registered to the Allen Brain Atlas. Red, MHb; green, LHb; blue, others; *, optotagged. See Figure S5C for more complete visualization. n = 6099 Hb neurons, including 29 optotagged Tac1MHb and 25 optotagged Tac1LHb.
(L) Spike raster plot for an example optotagged Tac1MHb neuron at 2, 5, 10 ms pulsewidth.
(M) Spike raster plot and firing rate across trials, for three example optotagged Tac1MHb neurons.
(N) Left, population-averaged baseline firing rate across trials for Tac1MHb neurons (p = 4.6 × 10⁻¹⁶); right, baseline firing rate across trials for Tac1LHb neurons (p = 0.10).
(O) Fraction of neurons in each brain area showing significant ramping up or ramping down across a behavioral session. See STAR Methods for statistical criteria for classifying ramping characteristics.
See also Figures S4 and S5.
