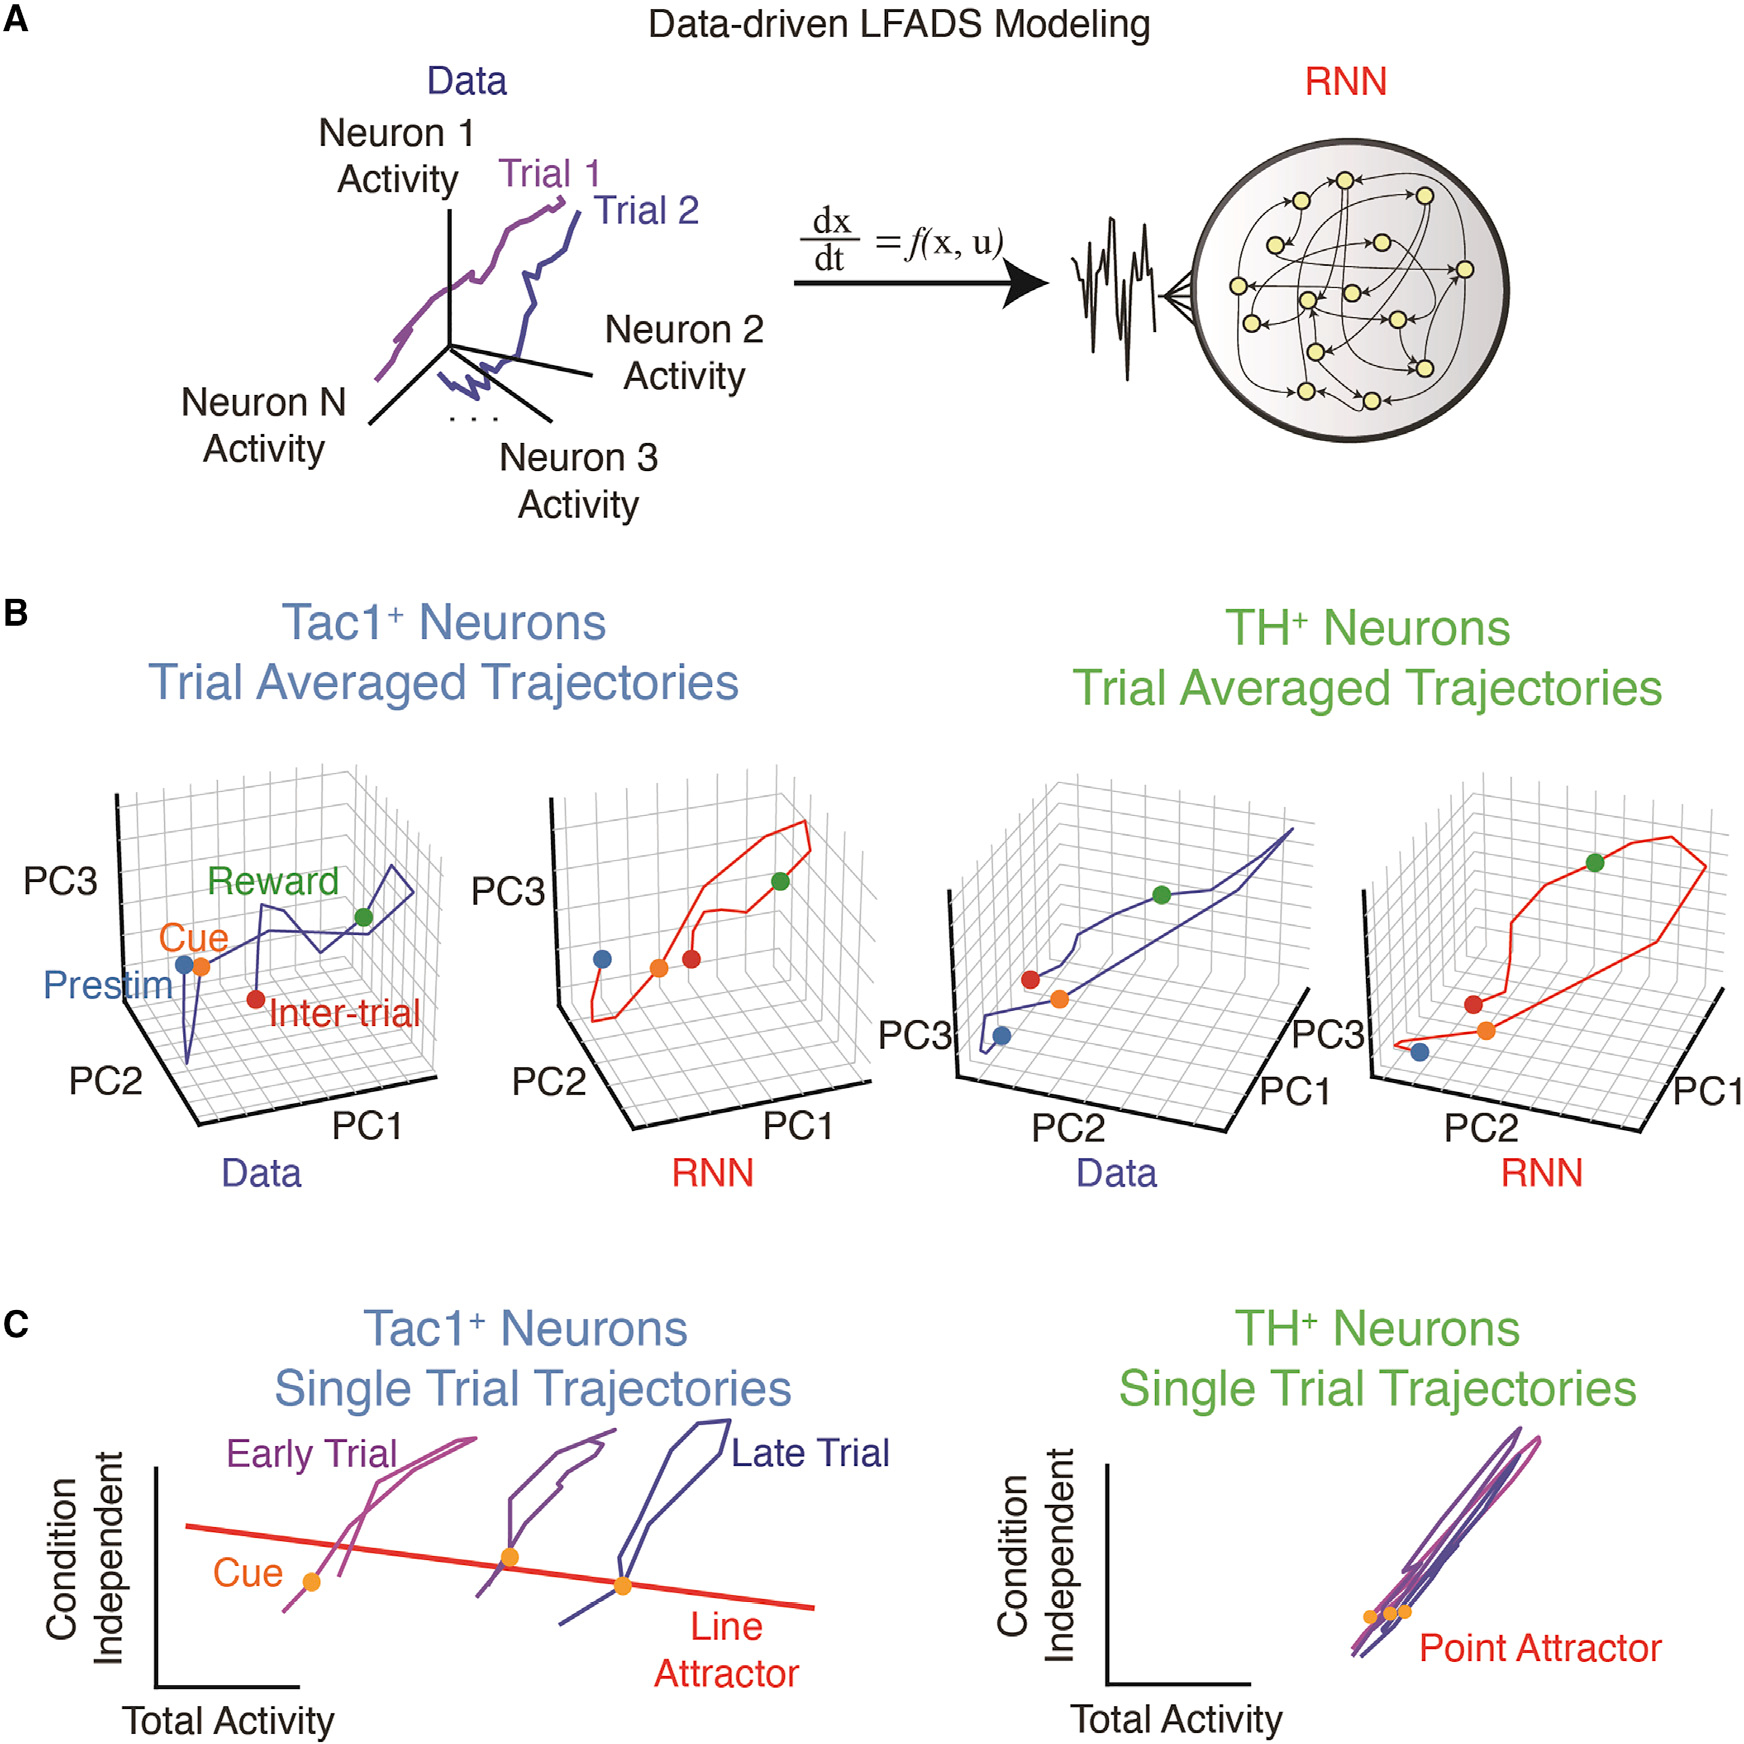
Figure 6. Data-driven modeling of cellular-resolution population activity identifies cell-type-specific attractor dynamics.

(A) LFADS modeling of neural population activity. The dynamics of Tac1MHb or TH+ neurons measured by two-photon microscopy can be described as trajectories in the neural state space (left). These trajectories can be generated by an RNN, which approximates the underlying neural dynamical system, at the single-trial level (right).
(B) The trial-averaged neural trajectory of Tac1MHb (left) and TH+ (right) neurons in the raw data and the RNN, demonstrating consistent epoch-dependent dynamics demarcated by the dots.
(C) Single-trial trajectories and the underlying attractor manifolds identified by fixed point analysis of the trLFADS generator RNN. In the Tac1MHb neurons (left), the line attractor integrates the external inputs over time, resulting in the trajectories shift along the line attractor as the session progress. Note the alignment of the line attractor and the total activity mode for Tac1MHb neurons, implying the progressive increase of total activity. The straight colored line is the top principal component of the identified fixed points. In the TH+ neurons (right), the discrete point attractor confines the trajectories, resulting in no change in total activity over time. The orange dots represent the cue onsets.
See also Figure S6.
