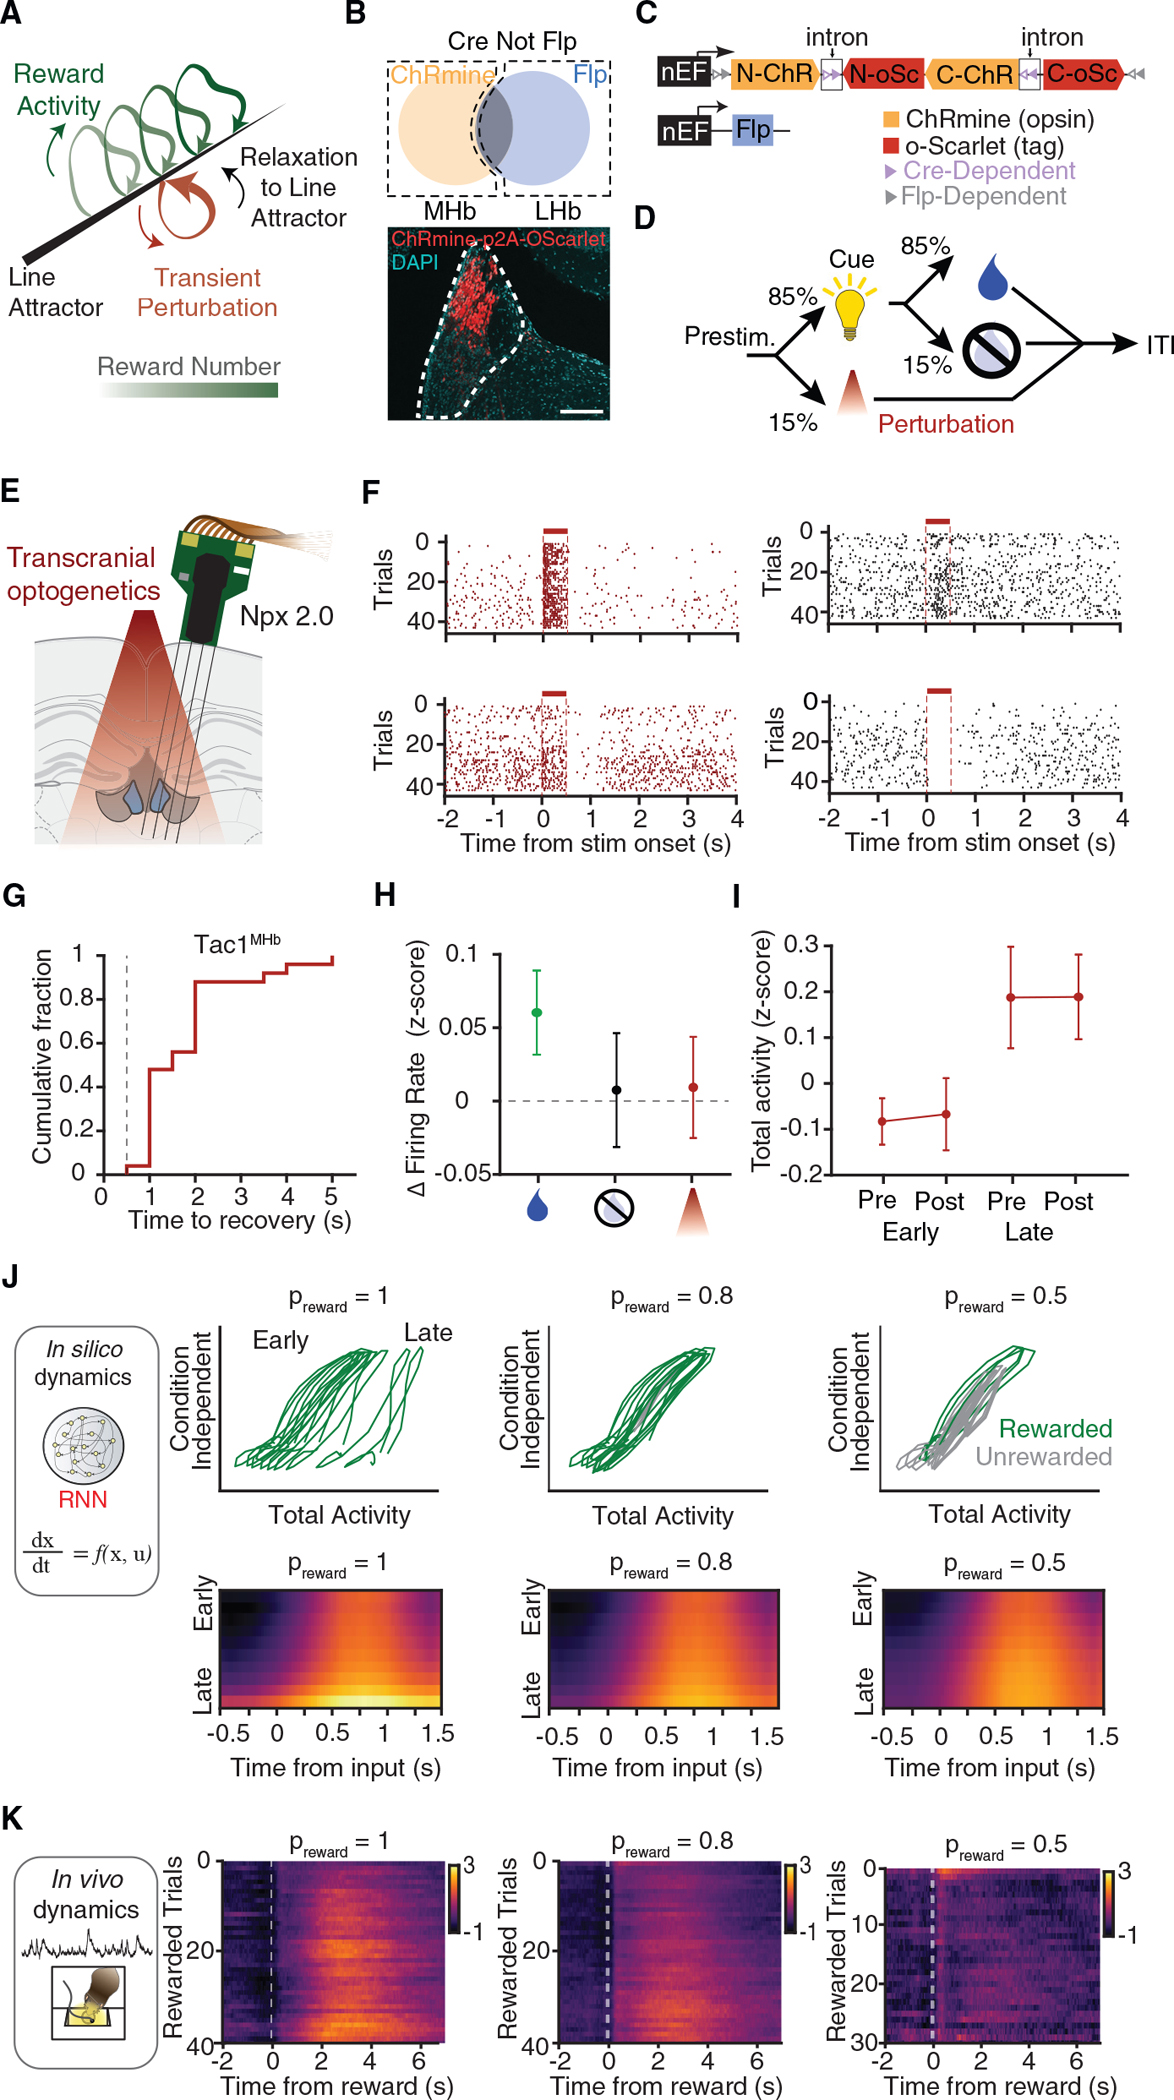
Figure 7. Transient optogenetic perturbation and reward history modulation experiments support the line attractor dynamics model.

(A) Schematic representation of transient optogenetic perturbation of the line attractor dynamics.
(B) Intersectional gene targeting approach. AAV1 CreOnFlpOff ChRmine-p2A-oScarlet is delivered to MHb and LHb neurons of Tac1-Cre mice. AAV8-Flp is delivered to the LHb to turn off ChRmine expression in Tac1LHb neurons.
(C) Constructs used for INTRSECT implementation as described in (B).
(D) Trial structure for the perturbation experiment.
(E) Experimental configuration for transcranial optogenetic stimulation and neural recording using Neuropixels 2.0 probes.
(F) Spike raster plots and firing rate changes for example validated optotagged MHb Tac1 neurons (left) or nearby modulated MHb neurons (right), which were all simultaneously recorded.
(G) Time to baseline recovery after perturbation for MHb neurons.
(H) Average firing rate changes in rewarded (green), unrewarded (black), and perturbation (red) trials. Curves: mean; error bar: SEM from hierarchical bootstrap. n = 1,078 neurons, 4 sessions, 2 mice.
(I) Within-trial and across-trial firing rate changes for optogenetic perturbation of MHb Tac1 neurons. Trials were split into early/late halves for concise visualization.
(J) Simulation of reward signal accumulation with varying reward probability (1.0, 0.8, and 0.5). Top, example state space trajectories show generated single sessions, initialized at the identical initial state. Bottom, model predictions on changes in total population activity (fiber photometry signal) across rewarded trials. For each case, 1,000 simulated sessions with random initial states were averaged.
(K) Fiber photometry recordings in 3CSRTT at 3 different reward probabilities: preward = 1, preward = 0.8, and preward = 0.5. Mean fluorescence (%ΔF/F) during reward as a function of nth correct trial in a session.
See also Figure S7.
