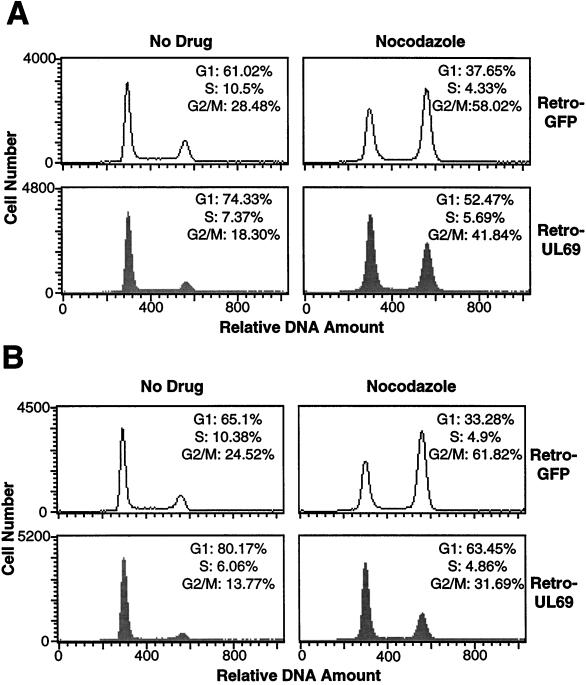
FIG. 4.
FACS analysis of HF cells infected with retroviruses expressing the UL69 protein or EGFP at a multiplicity of 5 fluorescence units per cell. At 48 h (A) or 60 h (B) after infection (left panels), the cells were subjected to FACS analysis. Nocodazole was added at 12 h before harvest to the samples analyzed in the right panels. The data displayed are from a single experiment representative of three independent experiments that produced similar results.

