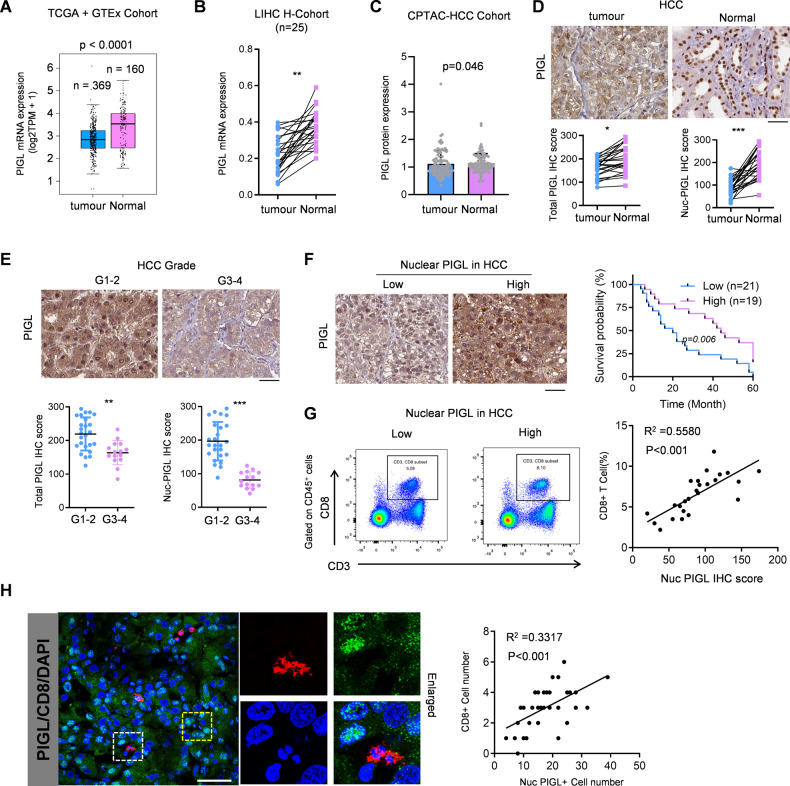
Fig. 2.
Nuclear PIGL was negatively correlated with HCC patient prognosis. A. PIGL mRNA was extracted from the TCGA-HCC database and analyzed. B PIGL mRNA levels from HCC patients (n = 25) were measured using qRT‒PCR. C PIGL protein levels in HCC samples were analyzed. D IHC staining for total PIGL and nuclear PIGL was obtained and analyzed. E The HCC patients were grouped into high or low grades according to pathological diagnosis. Representative images are shown, and the IHC scores for total PIGL and nuclear PIGL were calculated and analyzed. F The survival curves were plotted using the best cutoff of the IHC score. G, H CD8+ T-cell infiltration was measured using FCM and immunofluorescence (IF) and analyzed by calculating the Pearson correlation coefficient. D–F Scale bar, 200 μm; (H), scale bar, 50 μm; A–E, one-way ANOVA; F, two-way ANOVA; G–H Pearson correlation coefficient test (*p < 0.05; **p < 0.01; ***p < 0.001)

