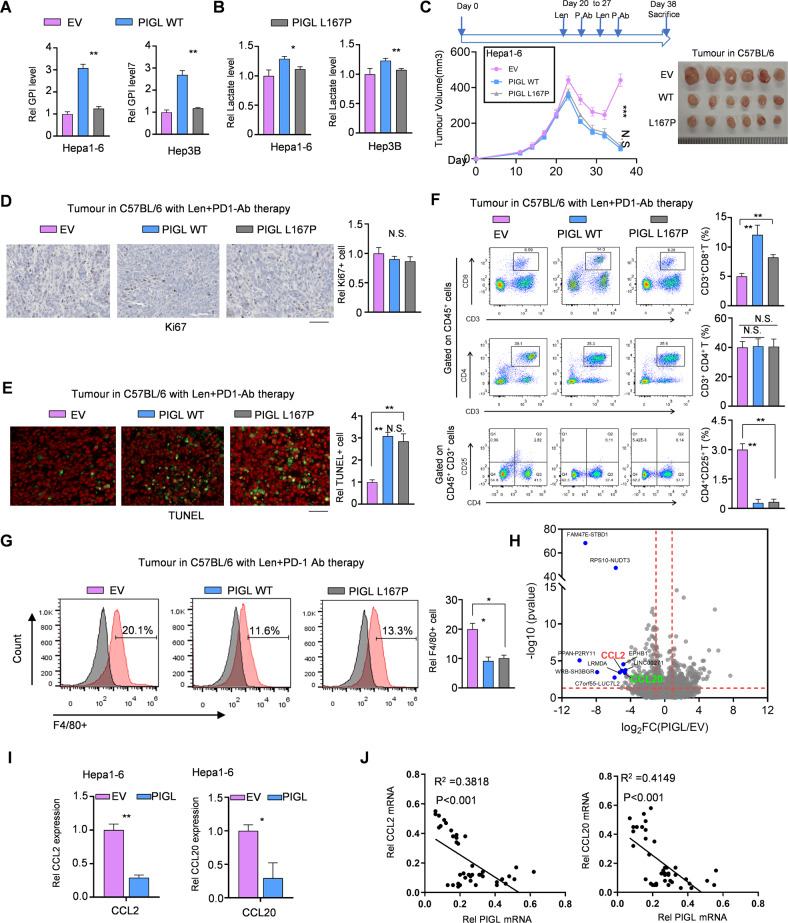
Fig. 3.
PIGL hampers liver tumor growth independent of its activity, likely by suppressing CCL2/20 expression. A, B GPI and lactate levels were measured in Hepa1-6 cells overexpressing control, WT-PIGL or L167P-PIGL. C Subcutaneous transplantation of Hepa1-6 cells with the indicated genetic manipulation into C57BL/6 mice (n = 6). D, E In the solid tumors shown in (C), in vivo cell proliferation (D) and cell death (E) were measured by performing Ki67 and TUNEL staining, respectively. Scale bar, 200 μm. F, G The proportions of the T-cell subsets helper T-cell (F) and F4/80+ macrophages (G) were analyzed using flow cytometry. The gray peaks in (G) are negative isotype controls. H–J Using Hepa1-6 cells overexpressing WT-PIGL or EV, RNA profiling was performed. The differentially expressed genes (DEGs) were analyzed, and the top 10 DEGs are presented (H). qRT‒PCR was performed using specific primers against CCL2/20 mRNAs (I). The correlation between PIGL mRNA expression and CCL2 mRNA or CCL20 mRNA expression was analyzed by calculating the Pearson correlation coefficient (J). A, B, D–H Two-tailed Student’s t-test.; C Two-way ANOVA; J Pearson correlation coefficient test (N.S., not significant; *p < 0.05; **p < 0.01)

