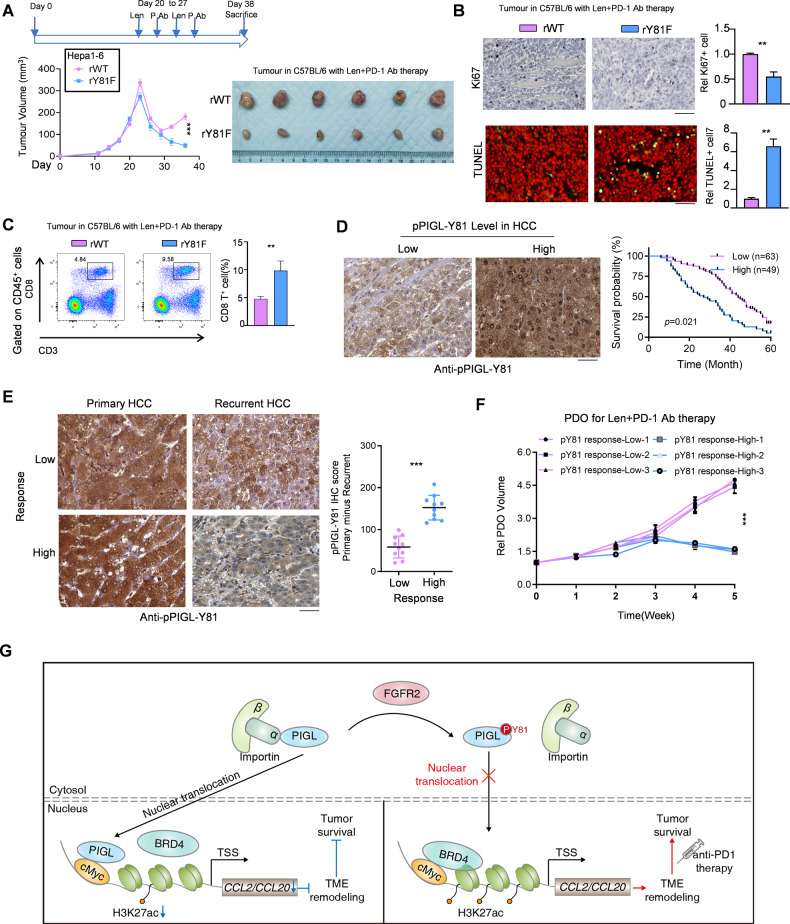
Fig. 7.
PIGL-Y81 phosphorylation predicts potential resistance to combined lenvatinib plus anti-PD-1 therapy. A Subcutaneous transplantation of Hepa1-6 cells with the indicated genetic manipulation into C57BL/6 mice (n = 6). B Cell proliferation (B, upper panel) and cell death (B, lower panel) were measured in vivo by performing Ki67 and TUNEL staining, respectively. Scale bar, 200 μm. C The CD8+CD3+ T-cell proportion in solid tumors shown in (A) was determined using FCM. D A total of 112 HCC patients were divided into two groups, indicated as high and low according to the IHC score for pPIGL-Y81 in HCC tissues. The survival curve was plotted with the best cutoff for the aforementioned IHC scores. Scale bar, 200 μm. E Twenty HCC patients who received lenvatinib treatment were separated into two groups by the median cutoff according to the change in IHC intensity in pPIGL-Y81 after lenvatinib treatment. A representative IHC image is shown (E, left panel). The change in the IHC score for HCC pPIGL-Y81 was analyzed (E, right panel). Scale bar, 200 μm. F Patient-derived organoids (PDOs) from three HCC samples with lower changes in pPIGL-Y81 and three HCC samples with higher changes in pPIGL-Y81 were prepared, and ectopic transplantation was performed for the combined treatment of lenvatinib and anti-PD-1 antibody with the indicated dosage described in the Methods section. G Schematic model of the mechanism by which FGFR2/PIGL axis-mediated CCL2/20 expression determines the efficiency of lenvatinib plus PD-1 therapy. A, D One-way ANOVA; B-C and E, two-tailed Student’s t-test; F Two-way ANOVA (**p < 0.01; ***p < 0.001)

