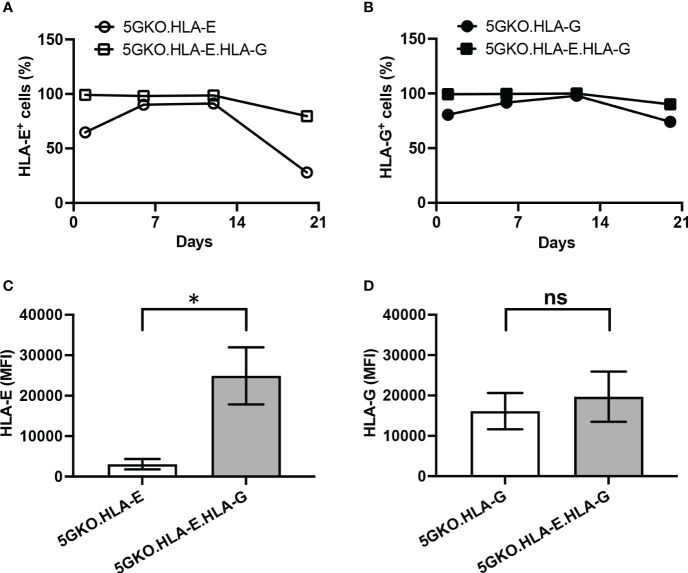
Figure 2.
Comparison of HLA-E and HLA-G stability and cell surface expression on porcine cells. The percentage of HLA-E positive cells (A) and HLA-G positive cells (B) in modified pig cells were examined at different time points. (C) Abundance of cell surface HLA-E was compared between 5GKO.HLA-E and 5GKO.HLA-E.HLA-G cell lines. (D) Abundance of cell surface HLA-G was compared between 5GKO.HLA-G and 5GKO.HLA-E.HLA-G cell lines. Data presented as mean ± SEM. Student’s t-test was used to analyze the difference between two groups. ns, not significant; *p < 0.05.

