
FIGURE 7.
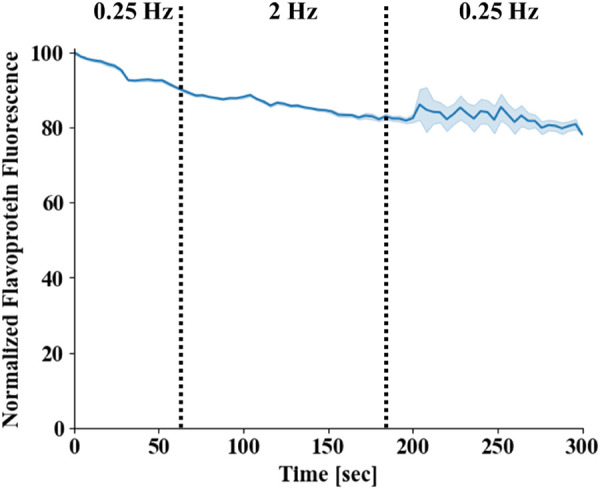
Flavoprotein homeostasis in atrial cells. Flavoprotein fluorescence in isolated atrial cells. The stimulus frequency was raised from 0.25 Hz to 2 Hz and then returned to 0.25 Hz (n = 4). Mean fluorescence is presented by a blue line and standard error by the light blue area around it. Note that the standard error increased towards the end of protocol, as the measurement of two of the cells was terminated before the end of the protocol due to technical issues.