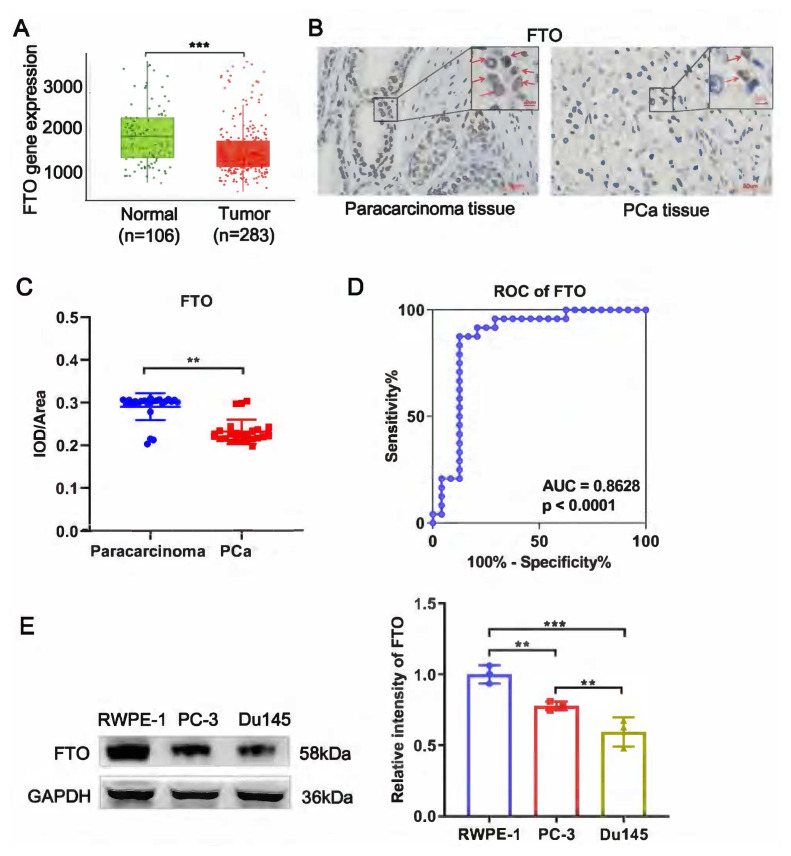
Figure 1.
FTO was downregulated in PCa. (A) The expression of FTO in human PCa tissue was significantly lower than that in normal tissues based on the TNMplot database (p = 8.92e-08). (B) IHC staining (n = 24) of FTO in PCa tissues and their adjacent noncancerous tissues. (C) Average IOD/area of FTO in IHC staining. IOD/area = Integrated optic density/positive areas. (D) ROC curve for FTO. (E) FTO expression in PCa cell line (Du145 and PC-3) and normal cell of RWPE-1 detected by WB. ** p < 0.01, *** p < 0.0001.

