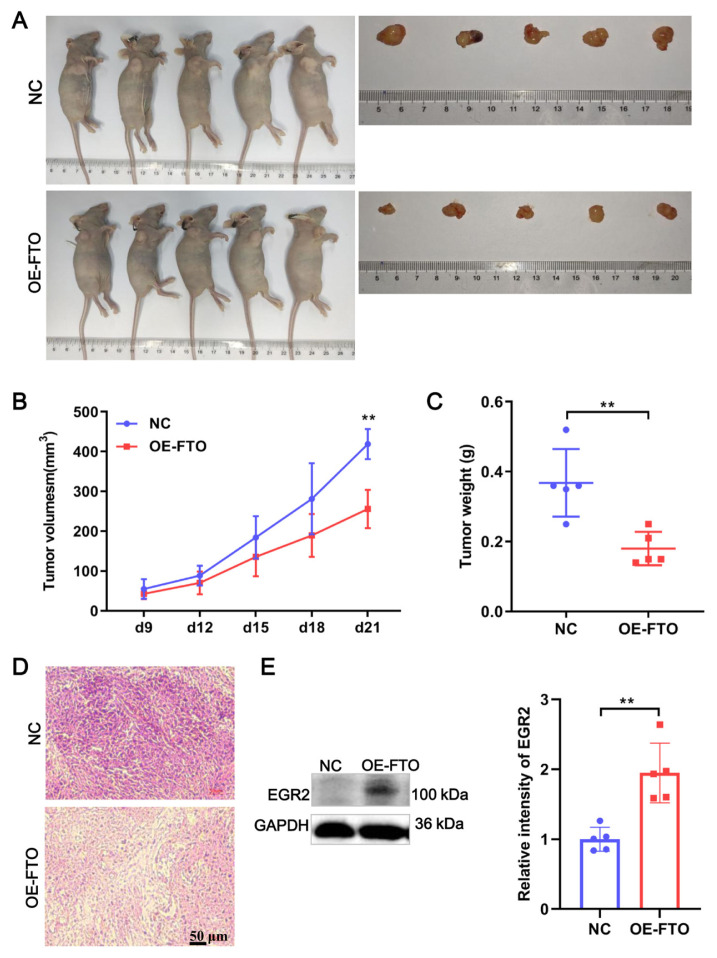
Figure 7.
FTO-suppressed PCa tumor growth. (A) Images of tumor-bearing mice. Tumor growth for individual mouse in each group was presented. (B) Tumor volume of mice in NC and OE-FTO group. (C) Tumor weight of mice in NC and OE-FTO group. (D) Representative images of HE staining of tumor tissues. (E) EGR2 expression in tumor tissue was detected by WB. ** p < 0.01.

