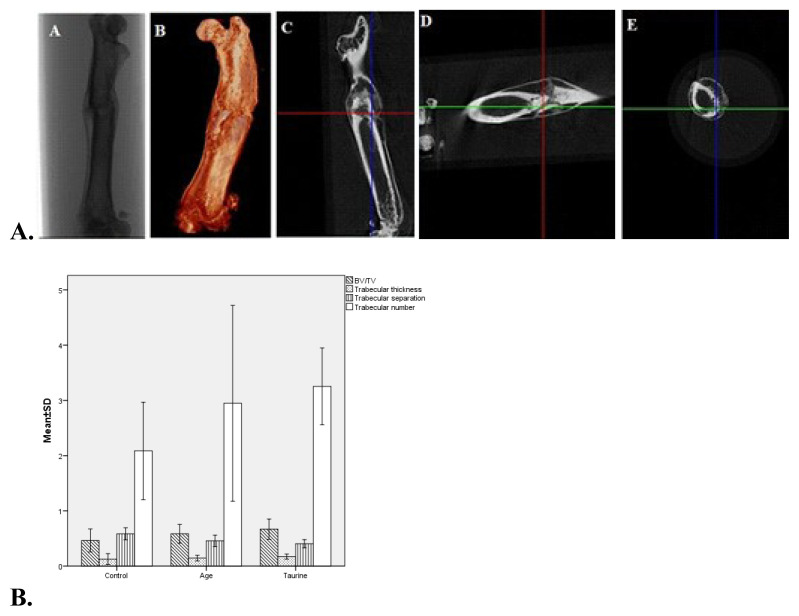
Figure 3.
A. Histomorphological (micro-CT) two-dimensional (A), three-dimensional (B), coronal (C), sagittal (D), and transaxial (E) images of the rat’s right femur osteoporotic fracture line at the taurine group (T6). B. Graphical comparison of micro-CT parameters of osteoporotic rat groups’ BV/TV (p = 0.03): bone volume/total volume, TbTh (p > 0.05): trabecular thickness, TbSp (p <0.01): trabecular separation, TbN (p < 0.01): trabecular number.

