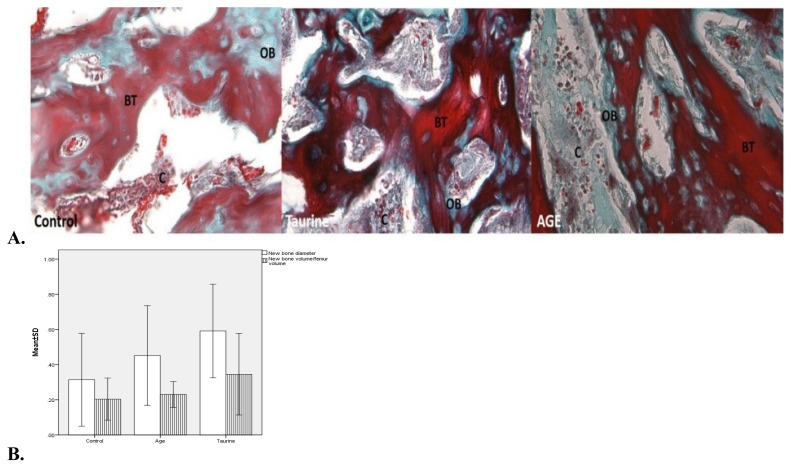
Figure 5.
A. Histologically representative photomicrographs of the fracture line and new bone areas of control, taurine, and aqueous garlic extract groups; areas of fibrocartilaginous callus (C), new bone trabeculae (BT), and old bone (OB). Masson trichrome, ×400. B. Graphical comparison of histological parameters of the groups’ new bone diameter (p = 0.002) and new bone volume/femur volume (p = 0.032).

