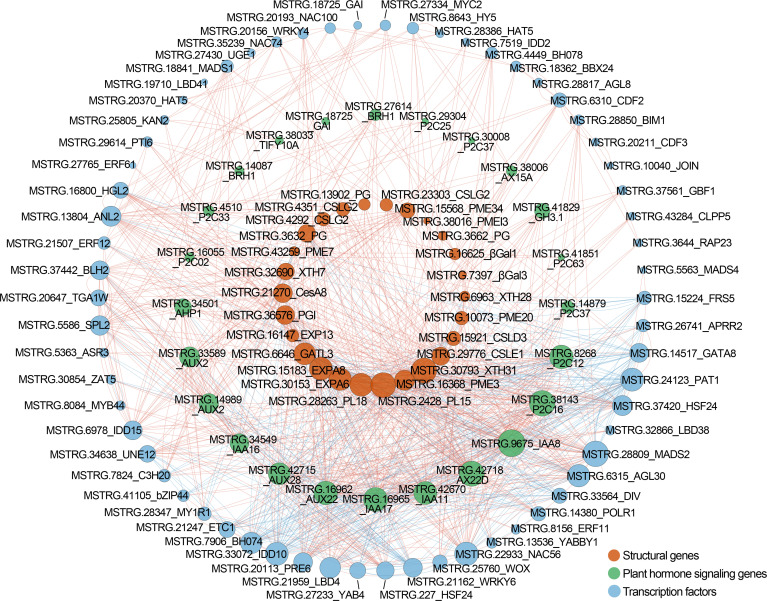
Figure 7.
Correlation network among structural genes, plant hormone signaling genes, and TF genes in Chinese cherry fruits. The red, green, and blue circles represent structural genes, plant hormone signaling genes, and TFs, respectively. The red and blue lines represent the positive and negative correlation. The gene descriptions are listed in Supplementary Table 9 .

