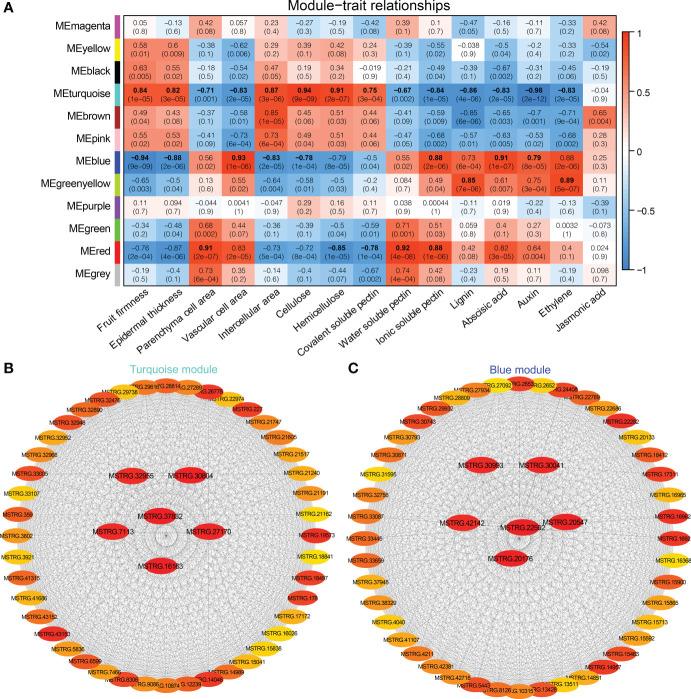
Figure 8.
WGCNA of DEGs identified from different stages and varieties in Chinese cherry fruits. (A) Module-trait relationships. The colors from blue to red represent r2 values from −1 to 1. (B, C) Gene co-expression networks and hub genes in module Turquoise and Blue. The gene description is given in Supplementary Tables 10 , 11 , respectively.

