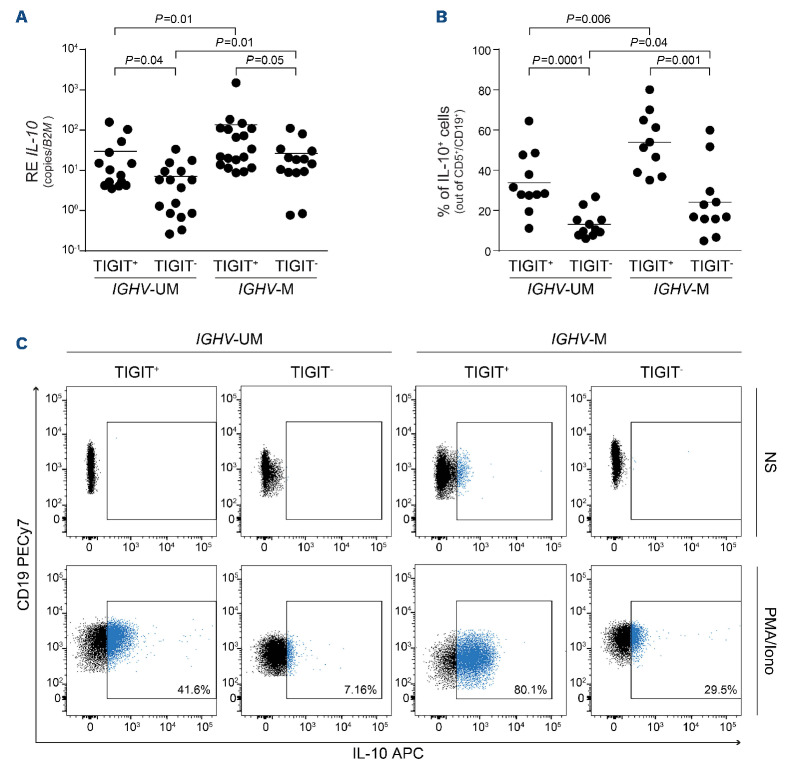
Figure 4.
TIGIT+ cells produce more IL-10. (A) Quantitative real-time polymerase chain reaction analysis of IL10 baseline expression of chronic lymphocytic leukemia (CLL) samples divided according to IGHV mutational status and TIGIT surface levels. (B) FACS analysis of IL-10 intracellular staining after 5 h stimulation with phorbol 12-myristate 13-acetate (50 ng/mL) and 1 μM ionomycin in CLL samples divided according to IGHV mutational status and TIGIT surface levels. (C) Representative flow cytometry plots of IL-10 production in unstimulated and stimulated CLL cells. Statistical analyses: Student t test. RE: relative expression; IL-10: interleukin-10: B2M: β2-microglobulin; UM: unmutated: M: mutated; NS: unstimulated; PMA/Iono: stimulated with phorbol 12-myristate 13-acetate/ionomycin.

