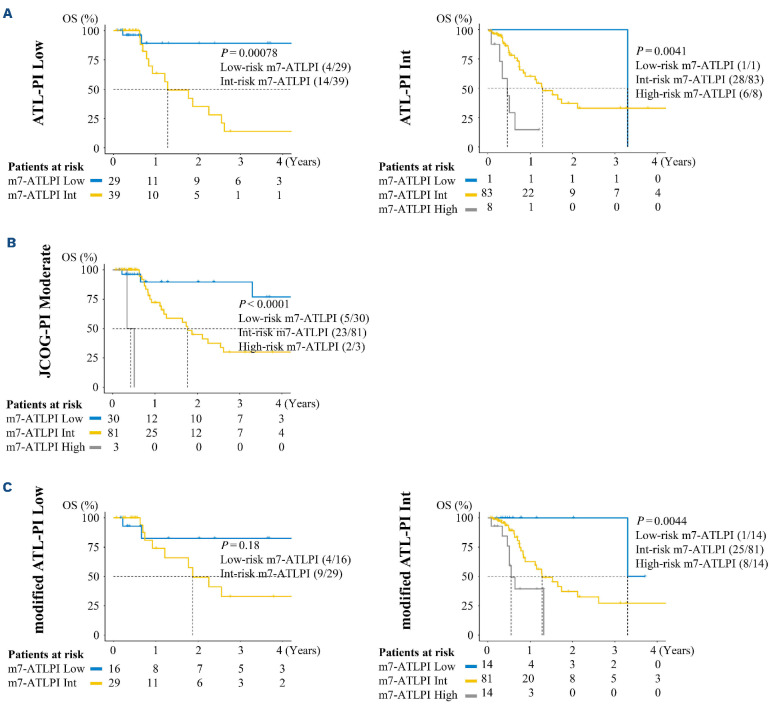
Figure 3.
m7-ATLPI segregates patients with favorable prognosis from among low- or intermediate-risk patients defined by ATL prognostic models based on clinical parameters. (A) Kaplan-Meier overall survival (OS) curves stratified by the m7-adult T-cell leukemia/lymphoma prognostic index (m7-ATLPI) for patients in the entire cohort (training and validation cohorts) who were classified as low risk or intermediate risk by the ATL-PI. (B) Kaplan-Meier OS curves stratified by the m7-ATLPI for patients in the entire cohort who were classified as moderate risk by the Japan Clinical Oncology Group prognostic index. (C) Kaplan-Meier OS curves stratified by the m7-ATLPI for patients in the entire cohort who were classified as low risk or intermediate risk by the modified ATL-PI. Numbers in parentheses show the number of patients with events/number of patients per cohort.

