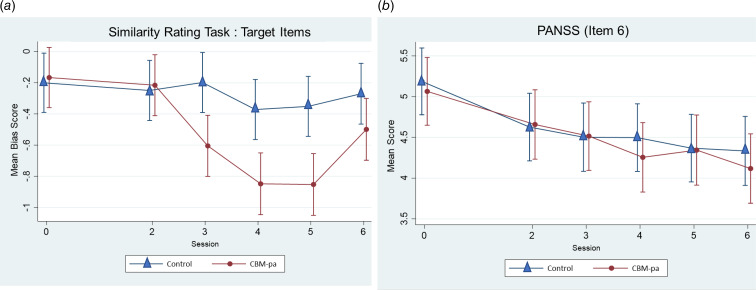
Fig. 5.
(a) Dose–response curve for interpretation bias. The figure shows the mean interpretation bias score (95% confidence intervals) at T0 (before the first session, dose = 0) and after sessions 2–6 (dose = 2–6) for each treatment arm. (b) Dose–response curve for PANSS item 6. The figure shows the mean PANSS item 6 score (95% confidence intervals) at T0 (before the first session, dose = 0) and after sessions 2–6 (dose = 2–6) for each treatment arm.

