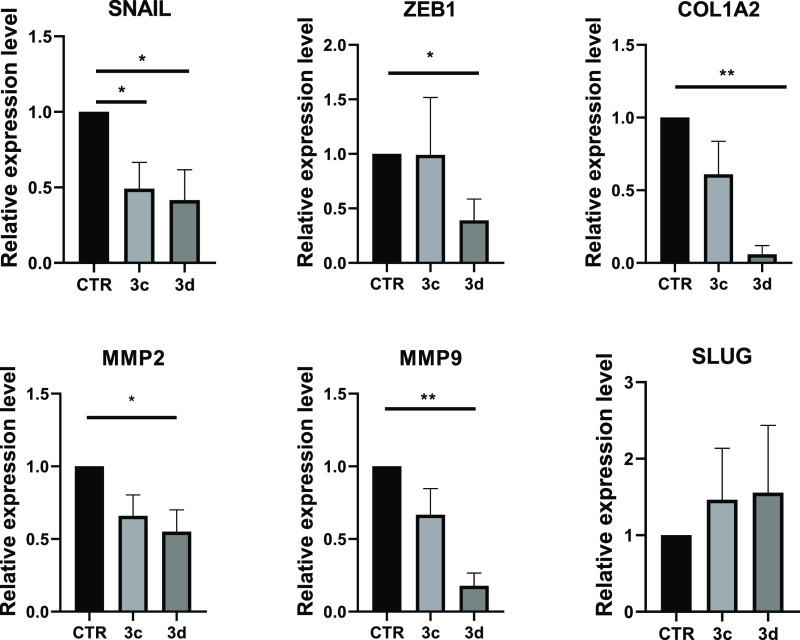
Figure 12.
qRT-PCR analysis for the indicated transcripts in MDA-MB-231 treated with the compounds 3c,d at 50 μM for 48 h. CTR (control) represent the cells treated with the vehicle (DMSO). The values are calculated by the 2(−ΔCt) method, expressed as fold of expression vs the control (arbitrary value = 1) and shown as mean ± SEM. Statistically significant differences are reported (*, p < 0.05; **, p < 0.01) for three independent experiments.

