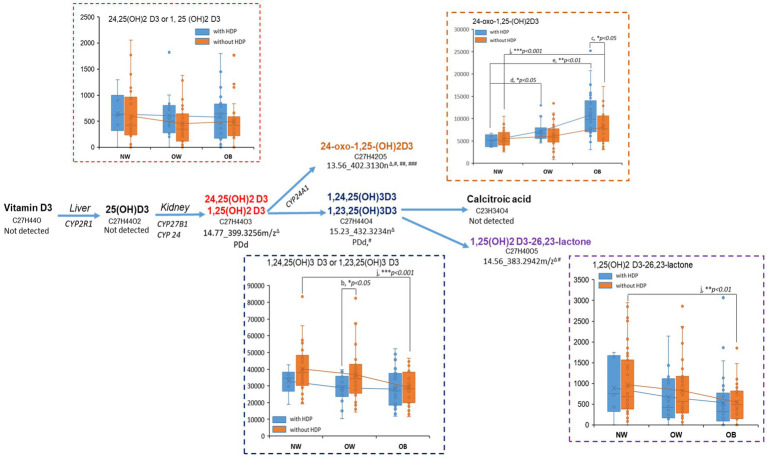
Figure 4.
Pertubation of metabolites on vitamin D pathway regarding BMI and HDP status. Metabolites in the enriched vitamin D3 pathway were first annotated by the Mummichog algorism in Metabanalyst via the empirical compound library and then verified by matching against the public database. PDd indicated the annotation was supported by the exact mass match in the public database. The current untargeted approach may not unambiguously identify the structural isomers because of lacking experimental spectra and chromatographic information in the in-house library. #metabolite determined to associate with BMI in the non-HDP and/or HDP group (Supplementary Table S1); ## metabolite determined to associate with HDP in at least one of the BMI categories (Supplementary Table S2); ### metabolite determined to associate with HDP and BMI by regression modeling (Table 3). The box plots of the annotated metabolites were based on the relative peak intensity of the corresponding signal (ΔRT_exact mass) and the classification with BMI categories (NW, normal weight; OW, overweight; OB, obese) and the HDP status (with-HDP, without HDP). The pairwise comparison between BMI category or between HDP status was conducted by student t-test or Wilcoxon Rank-Sum Test (if the sample size in one of the groups is <10). Pairwise comparisons: (a) HDP vs. without-HDP in NW; (b) with-HDP vs. without-HDP in OW; (c) with-HDP vs. without-HDP in OB; (d) OW vs. NW in with-HDP; (e) OB vs. NW in with-HDP; (f) OW vs. NW in without-HDP; (g) OB vs. NW in without-HDP. Comparisons with significant changes were labled in the box plots (*p < 0.05, **p < 0.01, ***p < 0.001).

