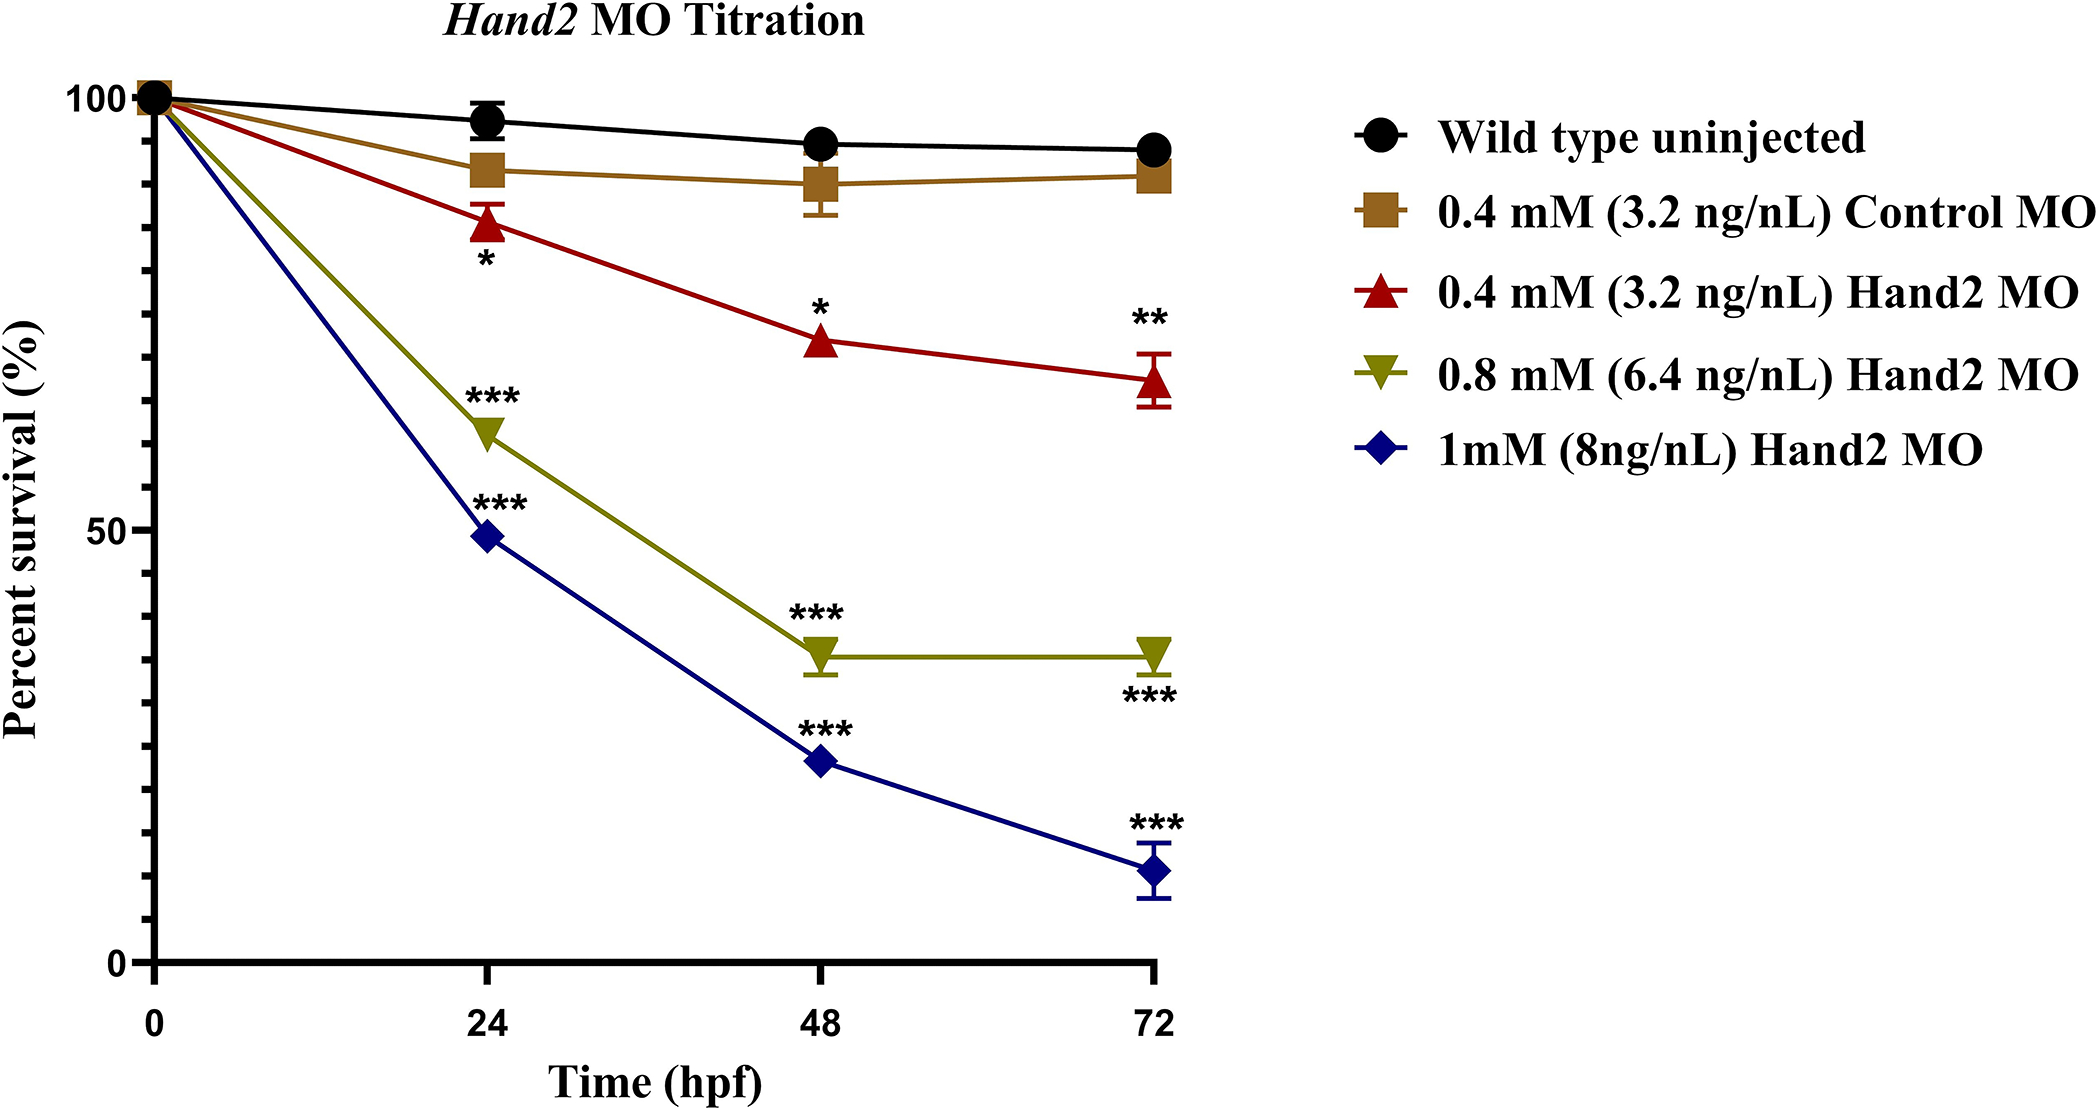
Figure 6: Hand2 MO titration.

Embryonic survival for different Hand2 MO concentrations was converted to a percentage, averaged, and plotted. The percent survival of MO-injected embryos was calculated at 24, 48, and 72 hpf. All data points represent mean ± SEM (100 embryos were used in each group; experiment was performed in triplicate). The analysis was done by two-way-ANOVA with Dunnett test. *p < 0.05, **p < 0.01, ***p < 0.001, and ****p < 0.0001.
